
Minimalist Linear Regression In Python
Necessary Imports
import numpy as np
import matplotlib.pyplot as plt
from sklearn.linear_model import LinearRegression
Input Data
x = np.array([1,20,40,60,80,100,120,140,180])         # INPUT X
y = np.array([6,30,80,150,180,210,230,280,320])       # TARGET OUTPUT Y
Predictive Model
model = LinearRegression()
# model.fit(x,y) # ERROR: x input data needs reshape
#model?
Preprocess Data
x = x.reshape(-1,1)
x
array([[  1],
       [ 20],
       [ 40],
       [ 60],
       [ 80],
       [100],
       [120],
       [140],
       [180]])
Training
model.fit(x,y)
LinearRegression(copy_X=True, fit_intercept=True, n_jobs=None, normalize=False)
Prediction
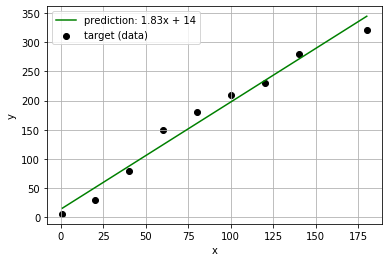
y_pred = model.predict(x)
plt.scatter(x,y, color='black', label='target (data)')
plt.plot(x,y_pred, color = 'green', label='prediction: 1.83x + 14')
plt.legend()
plt.xlabel('x')
plt.ylabel('y')
plt.grid("on")
model.score(x,y)
0.9739481928782231
model.coef_
array([1.83479361])
model.intercept_
14.046436915887767
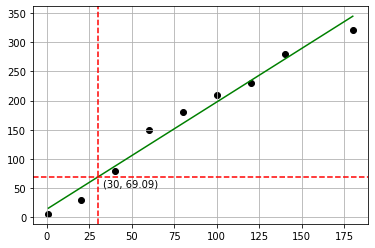
x0 = 30
predicted = model.predict(np.array([[x0]]))
predicted[0]
69.0902453271027
# Manual Solution using line equation:
1.83479*x0 + 14.04643
69.09013
plt.scatter(x,y, color='black')
plt.plot(x,y_pred, color = 'green')
plt.axvline(x=[30], color='r', linestyle='--')
plt.axhline(y=predicted, color='r', linestyle='--')
plt.annotate("(30, 69.09)",
                 xy=(30, 69.09),
                 xytext=(5, -10),
                 textcoords='offset points')
plt.grid("on")
Written on February 6, 2020