
Pandas Load Csv Or Excel Example
Download and extract data from: https://data.worldbank.org/country/philippines (Both CSV and EXCEL for demo)

1. Loading .csv file
import pandas as pd
# Loading the file. MAKE SURE THEY ARE IN THE SAME DIRECTORY, FILE AND NOTEBOOK.
raw = pd.read_csv('API_PHL_DS2_en_csv_v2_713923.csv', skiprows=4)
raw.head()
| Country Name | Country Code | Indicator Name | Indicator Code | 1960 | 1961 | 1962 | 1963 | 1964 | 1965 | ... | 2011 | 2012 | 2013 | 2014 | 2015 | 2016 | 2017 | 2018 | 2019 | Unnamed: 64 | |
|---|---|---|---|---|---|---|---|---|---|---|---|---|---|---|---|---|---|---|---|---|---|
| 0 | Philippines | PHL | Child employment in services (% of economicall... | SL.SRV.0714.ZS | NaN | NaN | NaN | NaN | NaN | NaN | ... | 40.19 | NaN | NaN | NaN | NaN | NaN | NaN | NaN | NaN | NaN |
| 1 | Philippines | PHL | Child employment in services, male (% of male ... | SL.SRV.0714.MA.ZS | NaN | NaN | NaN | NaN | NaN | NaN | ... | 31.00 | NaN | NaN | NaN | NaN | NaN | NaN | NaN | NaN | NaN |
| 2 | Philippines | PHL | Child employment in services, female (% of fem... | SL.SRV.0714.FE.ZS | NaN | NaN | NaN | NaN | NaN | NaN | ... | 54.65 | NaN | NaN | NaN | NaN | NaN | NaN | NaN | NaN | NaN |
| 3 | Philippines | PHL | Children in employment, self-employed (% of ch... | SL.SLF.0714.ZS | NaN | NaN | NaN | NaN | NaN | NaN | ... | 4.78 | NaN | NaN | NaN | NaN | NaN | NaN | NaN | NaN | NaN |
| 4 | Philippines | PHL | Children in employment, self-employed, male (%... | SL.SLF.0714.MA.ZS | NaN | NaN | NaN | NaN | NaN | NaN | ... | 5.73 | NaN | NaN | NaN | NaN | NaN | NaN | NaN | NaN | NaN |
5 rows × 65 columns
raw.set_index('Indicator Name', inplace=True)
raw.head()
| Country Name | Country Code | Indicator Code | 1960 | 1961 | 1962 | 1963 | 1964 | 1965 | 1966 | ... | 2011 | 2012 | 2013 | 2014 | 2015 | 2016 | 2017 | 2018 | 2019 | Unnamed: 64 | |
|---|---|---|---|---|---|---|---|---|---|---|---|---|---|---|---|---|---|---|---|---|---|
| Indicator Name | |||||||||||||||||||||
| Child employment in services (% of economically active children ages 7-14) | Philippines | PHL | SL.SRV.0714.ZS | NaN | NaN | NaN | NaN | NaN | NaN | NaN | ... | 40.19 | NaN | NaN | NaN | NaN | NaN | NaN | NaN | NaN | NaN |
| Child employment in services, male (% of male economically active children ages 7-14) | Philippines | PHL | SL.SRV.0714.MA.ZS | NaN | NaN | NaN | NaN | NaN | NaN | NaN | ... | 31.00 | NaN | NaN | NaN | NaN | NaN | NaN | NaN | NaN | NaN |
| Child employment in services, female (% of female economically active children ages 7-14) | Philippines | PHL | SL.SRV.0714.FE.ZS | NaN | NaN | NaN | NaN | NaN | NaN | NaN | ... | 54.65 | NaN | NaN | NaN | NaN | NaN | NaN | NaN | NaN | NaN |
| Children in employment, self-employed (% of children in employment, ages 7-14) | Philippines | PHL | SL.SLF.0714.ZS | NaN | NaN | NaN | NaN | NaN | NaN | NaN | ... | 4.78 | NaN | NaN | NaN | NaN | NaN | NaN | NaN | NaN | NaN |
| Children in employment, self-employed, male (% of male children in employment, ages 7-14) | Philippines | PHL | SL.SLF.0714.MA.ZS | NaN | NaN | NaN | NaN | NaN | NaN | NaN | ... | 5.73 | NaN | NaN | NaN | NaN | NaN | NaN | NaN | NaN | NaN |
5 rows × 64 columns
data = raw.iloc[:,3:]
data.head()
| 1960 | 1961 | 1962 | 1963 | 1964 | 1965 | 1966 | 1967 | 1968 | 1969 | ... | 2011 | 2012 | 2013 | 2014 | 2015 | 2016 | 2017 | 2018 | 2019 | Unnamed: 64 | |
|---|---|---|---|---|---|---|---|---|---|---|---|---|---|---|---|---|---|---|---|---|---|
| Indicator Name | |||||||||||||||||||||
| Child employment in services (% of economically active children ages 7-14) | NaN | NaN | NaN | NaN | NaN | NaN | NaN | NaN | NaN | NaN | ... | 40.19 | NaN | NaN | NaN | NaN | NaN | NaN | NaN | NaN | NaN |
| Child employment in services, male (% of male economically active children ages 7-14) | NaN | NaN | NaN | NaN | NaN | NaN | NaN | NaN | NaN | NaN | ... | 31.00 | NaN | NaN | NaN | NaN | NaN | NaN | NaN | NaN | NaN |
| Child employment in services, female (% of female economically active children ages 7-14) | NaN | NaN | NaN | NaN | NaN | NaN | NaN | NaN | NaN | NaN | ... | 54.65 | NaN | NaN | NaN | NaN | NaN | NaN | NaN | NaN | NaN |
| Children in employment, self-employed (% of children in employment, ages 7-14) | NaN | NaN | NaN | NaN | NaN | NaN | NaN | NaN | NaN | NaN | ... | 4.78 | NaN | NaN | NaN | NaN | NaN | NaN | NaN | NaN | NaN |
| Children in employment, self-employed, male (% of male children in employment, ages 7-14) | NaN | NaN | NaN | NaN | NaN | NaN | NaN | NaN | NaN | NaN | ... | 5.73 | NaN | NaN | NaN | NaN | NaN | NaN | NaN | NaN | NaN |
5 rows × 61 columns
data = data.T
data.head()
| Indicator Name | Child employment in services (% of economically active children ages 7-14) | Child employment in services, male (% of male economically active children ages 7-14) | Child employment in services, female (% of female economically active children ages 7-14) | Children in employment, self-employed (% of children in employment, ages 7-14) | Children in employment, self-employed, male (% of male children in employment, ages 7-14) | Children in employment, self-employed, female (% of female children in employment, ages 7-14) | Child employment in manufacturing (% of economically active children ages 7-14) | Child employment in manufacturing, male (% of male economically active children ages 7-14) | Child employment in manufacturing, female (% of female economically active children ages 7-14) | Informal employment (% of total non-agricultural employment) | ... | Net official flows from UN agencies, UNAIDS (current US$) | Net financial flows, RDB nonconcessional (NFL, current US$) | Net financial flows, RDB concessional (NFL, current US$) | PPG, private creditors (NFL, current US$) | PPG, other private creditors (NFL, current US$) | PNG, commercial banks and other creditors (NFL, current US$) | PNG, bonds (NFL, current US$) | Commercial banks and other lending (PPG + PNG) (NFL, current US$) | PPG, commercial banks (NFL, current US$) | PPG, bonds (NFL, current US$) |
|---|---|---|---|---|---|---|---|---|---|---|---|---|---|---|---|---|---|---|---|---|---|
| 1960 | NaN | NaN | NaN | NaN | NaN | NaN | NaN | NaN | NaN | NaN | ... | NaN | NaN | NaN | NaN | NaN | NaN | NaN | NaN | NaN | NaN |
| 1961 | NaN | NaN | NaN | NaN | NaN | NaN | NaN | NaN | NaN | NaN | ... | NaN | NaN | NaN | NaN | NaN | NaN | NaN | NaN | NaN | NaN |
| 1962 | NaN | NaN | NaN | NaN | NaN | NaN | NaN | NaN | NaN | NaN | ... | NaN | NaN | NaN | NaN | NaN | NaN | NaN | NaN | NaN | NaN |
| 1963 | NaN | NaN | NaN | NaN | NaN | NaN | NaN | NaN | NaN | NaN | ... | NaN | NaN | NaN | NaN | NaN | NaN | NaN | NaN | NaN | NaN |
| 1964 | NaN | NaN | NaN | NaN | NaN | NaN | NaN | NaN | NaN | NaN | ... | NaN | NaN | NaN | NaN | NaN | NaN | NaN | NaN | NaN | NaN |
5 rows × 1429 columns
data.tail()
| Indicator Name | Child employment in services (% of economically active children ages 7-14) | Child employment in services, male (% of male economically active children ages 7-14) | Child employment in services, female (% of female economically active children ages 7-14) | Children in employment, self-employed (% of children in employment, ages 7-14) | Children in employment, self-employed, male (% of male children in employment, ages 7-14) | Children in employment, self-employed, female (% of female children in employment, ages 7-14) | Child employment in manufacturing (% of economically active children ages 7-14) | Child employment in manufacturing, male (% of male economically active children ages 7-14) | Child employment in manufacturing, female (% of female economically active children ages 7-14) | Informal employment (% of total non-agricultural employment) | ... | Net official flows from UN agencies, UNAIDS (current US$) | Net financial flows, RDB nonconcessional (NFL, current US$) | Net financial flows, RDB concessional (NFL, current US$) | PPG, private creditors (NFL, current US$) | PPG, other private creditors (NFL, current US$) | PNG, commercial banks and other creditors (NFL, current US$) | PNG, bonds (NFL, current US$) | Commercial banks and other lending (PPG + PNG) (NFL, current US$) | PPG, commercial banks (NFL, current US$) | PPG, bonds (NFL, current US$) |
|---|---|---|---|---|---|---|---|---|---|---|---|---|---|---|---|---|---|---|---|---|---|
| 2016 | NaN | NaN | NaN | NaN | NaN | NaN | NaN | NaN | NaN | NaN | ... | 330000.0 | 395910000.0 | -95158000.0 | -2.532091e+09 | -2256000.0 | -1.074806e+09 | -100000000.0 | -940524000.0 | 136538000.0 | -2.666373e+09 |
| 2017 | NaN | NaN | NaN | NaN | NaN | NaN | NaN | NaN | NaN | NaN | ... | 190000.0 | 126293000.0 | -96047000.0 | 3.258590e+08 | -2225000.0 | -6.331680e+08 | 700000000.0 | -678071000.0 | -42678000.0 | 3.707620e+08 |
| 2018 | NaN | NaN | NaN | NaN | NaN | NaN | NaN | NaN | NaN | NaN | ... | NaN | 401180000.0 | -82567000.0 | 2.587989e+09 | -2219000.0 | -1.538270e+08 | 725000000.0 | -184586000.0 | -28540000.0 | 2.618748e+09 |
| 2019 | NaN | NaN | NaN | NaN | NaN | NaN | NaN | NaN | NaN | NaN | ... | NaN | NaN | NaN | NaN | NaN | NaN | NaN | NaN | NaN | NaN |
| Unnamed: 64 | NaN | NaN | NaN | NaN | NaN | NaN | NaN | NaN | NaN | NaN | ... | NaN | NaN | NaN | NaN | NaN | NaN | NaN | NaN | NaN | NaN |
5 rows × 1429 columns
# Remove "Unnamed: 64" extra row
data = data.iloc[:-1]
data.tail()
| Indicator Name | Child employment in services (% of economically active children ages 7-14) | Child employment in services, male (% of male economically active children ages 7-14) | Child employment in services, female (% of female economically active children ages 7-14) | Children in employment, self-employed (% of children in employment, ages 7-14) | Children in employment, self-employed, male (% of male children in employment, ages 7-14) | Children in employment, self-employed, female (% of female children in employment, ages 7-14) | Child employment in manufacturing (% of economically active children ages 7-14) | Child employment in manufacturing, male (% of male economically active children ages 7-14) | Child employment in manufacturing, female (% of female economically active children ages 7-14) | Informal employment (% of total non-agricultural employment) | ... | Net official flows from UN agencies, UNAIDS (current US$) | Net financial flows, RDB nonconcessional (NFL, current US$) | Net financial flows, RDB concessional (NFL, current US$) | PPG, private creditors (NFL, current US$) | PPG, other private creditors (NFL, current US$) | PNG, commercial banks and other creditors (NFL, current US$) | PNG, bonds (NFL, current US$) | Commercial banks and other lending (PPG + PNG) (NFL, current US$) | PPG, commercial banks (NFL, current US$) | PPG, bonds (NFL, current US$) |
|---|---|---|---|---|---|---|---|---|---|---|---|---|---|---|---|---|---|---|---|---|---|
| 2015 | NaN | NaN | NaN | NaN | NaN | NaN | NaN | NaN | NaN | NaN | ... | 350000.0 | 610131000.0 | -92764000.0 | 2.497690e+09 | -2025000.0 | 1.992369e+09 | -537502000.0 | 1.895185e+09 | -95159000.0 | 2.594874e+09 |
| 2016 | NaN | NaN | NaN | NaN | NaN | NaN | NaN | NaN | NaN | NaN | ... | 330000.0 | 395910000.0 | -95158000.0 | -2.532091e+09 | -2256000.0 | -1.074806e+09 | -100000000.0 | -9.405240e+08 | 136538000.0 | -2.666373e+09 |
| 2017 | NaN | NaN | NaN | NaN | NaN | NaN | NaN | NaN | NaN | NaN | ... | 190000.0 | 126293000.0 | -96047000.0 | 3.258590e+08 | -2225000.0 | -6.331680e+08 | 700000000.0 | -6.780710e+08 | -42678000.0 | 3.707620e+08 |
| 2018 | NaN | NaN | NaN | NaN | NaN | NaN | NaN | NaN | NaN | NaN | ... | NaN | 401180000.0 | -82567000.0 | 2.587989e+09 | -2219000.0 | -1.538270e+08 | 725000000.0 | -1.845860e+08 | -28540000.0 | 2.618748e+09 |
| 2019 | NaN | NaN | NaN | NaN | NaN | NaN | NaN | NaN | NaN | NaN | ... | NaN | NaN | NaN | NaN | NaN | NaN | NaN | NaN | NaN | NaN |
5 rows × 1429 columns
#Basic plotting
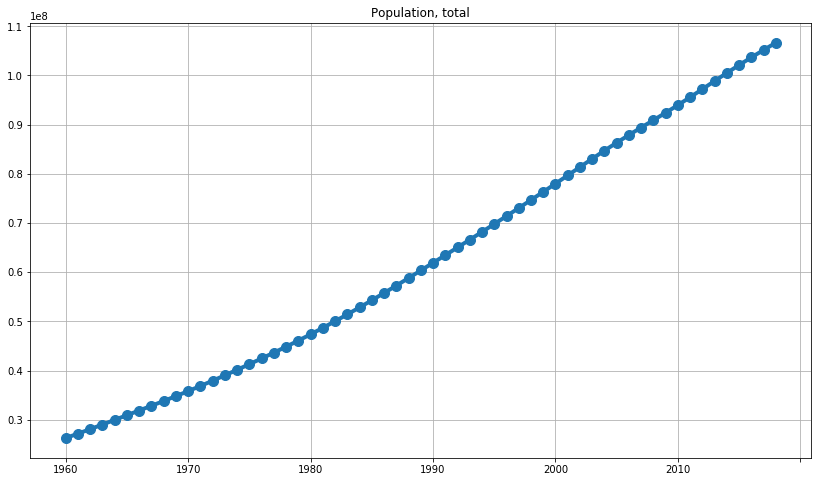
indicator = 'Population, total'
data[indicator].plot(grid=True, figsize=(14,8), title=indicator, lw = 4, marker='.', markersize=20)
<matplotlib.axes._subplots.AxesSubplot at 0x7f918f43a610>

data.tail()
| Indicator Name | Child employment in services (% of economically active children ages 7-14) | Child employment in services, male (% of male economically active children ages 7-14) | Child employment in services, female (% of female economically active children ages 7-14) | Children in employment, self-employed (% of children in employment, ages 7-14) | Children in employment, self-employed, male (% of male children in employment, ages 7-14) | Children in employment, self-employed, female (% of female children in employment, ages 7-14) | Child employment in manufacturing (% of economically active children ages 7-14) | Child employment in manufacturing, male (% of male economically active children ages 7-14) | Child employment in manufacturing, female (% of female economically active children ages 7-14) | Informal employment (% of total non-agricultural employment) | ... | Net official flows from UN agencies, UNAIDS (current US$) | Net financial flows, RDB nonconcessional (NFL, current US$) | Net financial flows, RDB concessional (NFL, current US$) | PPG, private creditors (NFL, current US$) | PPG, other private creditors (NFL, current US$) | PNG, commercial banks and other creditors (NFL, current US$) | PNG, bonds (NFL, current US$) | Commercial banks and other lending (PPG + PNG) (NFL, current US$) | PPG, commercial banks (NFL, current US$) | PPG, bonds (NFL, current US$) |
|---|---|---|---|---|---|---|---|---|---|---|---|---|---|---|---|---|---|---|---|---|---|
| 2016 | NaN | NaN | NaN | NaN | NaN | NaN | NaN | NaN | NaN | NaN | ... | 330000.0 | 395910000.0 | -95158000.0 | -2.532091e+09 | -2256000.0 | -1.074806e+09 | -100000000.0 | -940524000.0 | 136538000.0 | -2.666373e+09 |
| 2017 | NaN | NaN | NaN | NaN | NaN | NaN | NaN | NaN | NaN | NaN | ... | 190000.0 | 126293000.0 | -96047000.0 | 3.258590e+08 | -2225000.0 | -6.331680e+08 | 700000000.0 | -678071000.0 | -42678000.0 | 3.707620e+08 |
| 2018 | NaN | NaN | NaN | NaN | NaN | NaN | NaN | NaN | NaN | NaN | ... | NaN | 401180000.0 | -82567000.0 | 2.587989e+09 | -2219000.0 | -1.538270e+08 | 725000000.0 | -184586000.0 | -28540000.0 | 2.618748e+09 |
| 2019 | NaN | NaN | NaN | NaN | NaN | NaN | NaN | NaN | NaN | NaN | ... | NaN | NaN | NaN | NaN | NaN | NaN | NaN | NaN | NaN | NaN |
| Unnamed: 64 | NaN | NaN | NaN | NaN | NaN | NaN | NaN | NaN | NaN | NaN | ... | NaN | NaN | NaN | NaN | NaN | NaN | NaN | NaN | NaN | NaN |
5 rows × 1429 columns
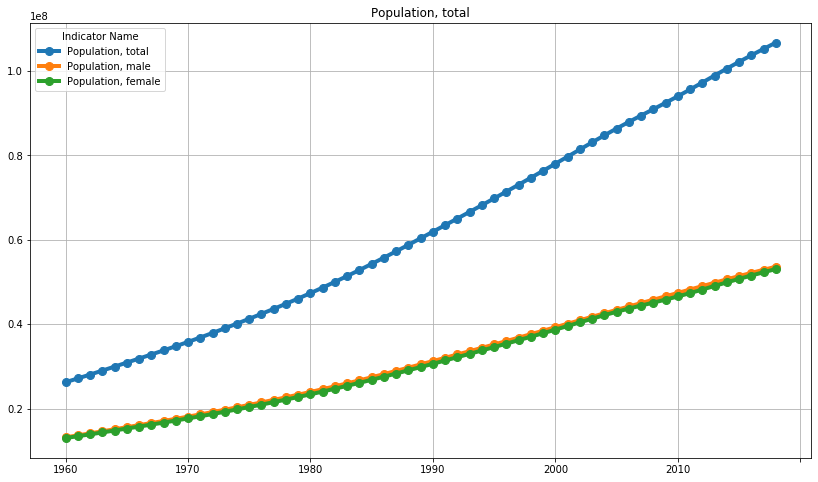
indicators = ['Population, total','Population, male','Population, female']
data[indicators].plot(grid=True, figsize=(14,8), title=indicator, lw = 4, marker='.', markersize=16)
<matplotlib.axes._subplots.AxesSubplot at 0x7f918ed1da10>
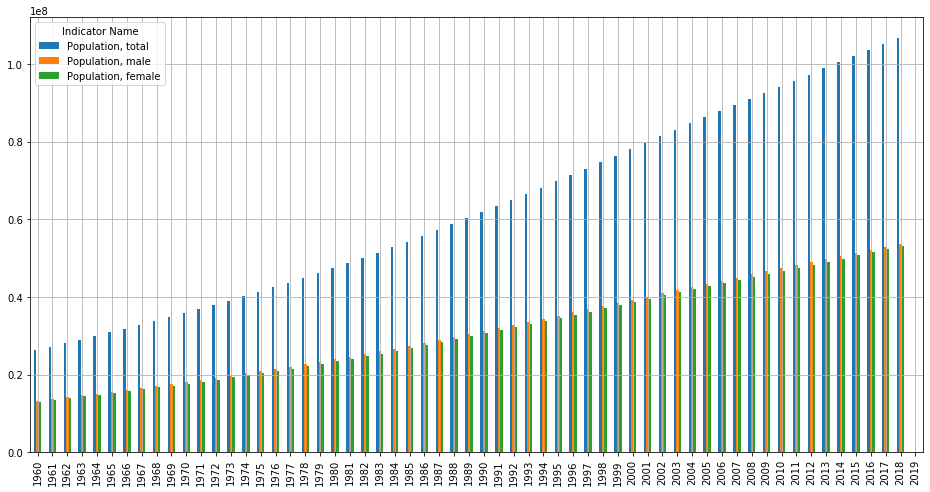
data[indicators].plot(grid=True, figsize=(16,8), kind='bar')
<matplotlib.axes._subplots.AxesSubplot at 0x7f918e6b4b90>

2. Loading .xls file
# Loading the file. MAKE SURE THEY ARE IN THE SAME DIRECTORY, FILE AND NOTEBOOK.
raw = pd.read_excel("API_PHL_DS2_en_excel_v2_716225.xls", header=3, sheet_name='Data')
raw.head()
| Country Name | Country Code | Indicator Name | Indicator Code | 1960 | 1961 | 1962 | 1963 | 1964 | 1965 | ... | 2010 | 2011 | 2012 | 2013 | 2014 | 2015 | 2016 | 2017 | 2018 | 2019 | |
|---|---|---|---|---|---|---|---|---|---|---|---|---|---|---|---|---|---|---|---|---|---|
| 0 | Philippines | PHL | Child employment in agriculture, male (% of ma... | SL.AGR.0714.MA.ZS | NaN | NaN | NaN | NaN | NaN | NaN | ... | NaN | 64.40 | NaN | NaN | NaN | NaN | NaN | NaN | NaN | NaN |
| 1 | Philippines | PHL | Child employment in agriculture, female (% of ... | SL.AGR.0714.FE.ZS | NaN | NaN | NaN | NaN | NaN | NaN | ... | NaN | 38.77 | NaN | NaN | NaN | NaN | NaN | NaN | NaN | NaN |
| 2 | Philippines | PHL | Annualized average growth rate in per capita r... | SI.SPR.PCAP.ZG | NaN | NaN | NaN | NaN | NaN | NaN | ... | NaN | NaN | NaN | NaN | NaN | 2.56 | NaN | NaN | NaN | NaN |
| 3 | Philippines | PHL | Survey mean consumption or income per capita, ... | SI.SPR.PCAP | NaN | NaN | NaN | NaN | NaN | NaN | ... | NaN | NaN | 6.92 | NaN | NaN | 7.46 | NaN | NaN | NaN | NaN |
| 4 | Philippines | PHL | Annualized average growth rate in per capita r... | SI.SPR.PC40.ZG | NaN | NaN | NaN | NaN | NaN | NaN | ... | NaN | NaN | NaN | NaN | NaN | 5.12 | NaN | NaN | NaN | NaN |
5 rows × 64 columns
raw.set_index('Indicator Name', inplace=True)
raw.head()
| Country Name | Country Code | Indicator Code | 1960 | 1961 | 1962 | 1963 | 1964 | 1965 | 1966 | ... | 2010 | 2011 | 2012 | 2013 | 2014 | 2015 | 2016 | 2017 | 2018 | 2019 | |
|---|---|---|---|---|---|---|---|---|---|---|---|---|---|---|---|---|---|---|---|---|---|
| Indicator Name | |||||||||||||||||||||
| Child employment in agriculture, male (% of male economically active children ages 7-14) | Philippines | PHL | SL.AGR.0714.MA.ZS | NaN | NaN | NaN | NaN | NaN | NaN | NaN | ... | NaN | 64.40 | NaN | NaN | NaN | NaN | NaN | NaN | NaN | NaN |
| Child employment in agriculture, female (% of female economically active children ages 7-14) | Philippines | PHL | SL.AGR.0714.FE.ZS | NaN | NaN | NaN | NaN | NaN | NaN | NaN | ... | NaN | 38.77 | NaN | NaN | NaN | NaN | NaN | NaN | NaN | NaN |
| Annualized average growth rate in per capita real survey mean consumption or income, total population (%) | Philippines | PHL | SI.SPR.PCAP.ZG | NaN | NaN | NaN | NaN | NaN | NaN | NaN | ... | NaN | NaN | NaN | NaN | NaN | 2.56 | NaN | NaN | NaN | NaN |
| Survey mean consumption or income per capita, total population (2011 PPP $ per day) | Philippines | PHL | SI.SPR.PCAP | NaN | NaN | NaN | NaN | NaN | NaN | NaN | ... | NaN | NaN | 6.92 | NaN | NaN | 7.46 | NaN | NaN | NaN | NaN |
| Annualized average growth rate in per capita real survey mean consumption or income, bottom 40% of population (%) | Philippines | PHL | SI.SPR.PC40.ZG | NaN | NaN | NaN | NaN | NaN | NaN | NaN | ... | NaN | NaN | NaN | NaN | NaN | 5.12 | NaN | NaN | NaN | NaN |
5 rows × 63 columns
# Choose Numeric Values ONLY
data = raw.iloc[:,3:]
data.head()
| 1960 | 1961 | 1962 | 1963 | 1964 | 1965 | 1966 | 1967 | 1968 | 1969 | ... | 2010 | 2011 | 2012 | 2013 | 2014 | 2015 | 2016 | 2017 | 2018 | 2019 | |
|---|---|---|---|---|---|---|---|---|---|---|---|---|---|---|---|---|---|---|---|---|---|
| Indicator Name | |||||||||||||||||||||
| Child employment in agriculture, male (% of male economically active children ages 7-14) | NaN | NaN | NaN | NaN | NaN | NaN | NaN | NaN | NaN | NaN | ... | NaN | 64.40 | NaN | NaN | NaN | NaN | NaN | NaN | NaN | NaN |
| Child employment in agriculture, female (% of female economically active children ages 7-14) | NaN | NaN | NaN | NaN | NaN | NaN | NaN | NaN | NaN | NaN | ... | NaN | 38.77 | NaN | NaN | NaN | NaN | NaN | NaN | NaN | NaN |
| Annualized average growth rate in per capita real survey mean consumption or income, total population (%) | NaN | NaN | NaN | NaN | NaN | NaN | NaN | NaN | NaN | NaN | ... | NaN | NaN | NaN | NaN | NaN | 2.56 | NaN | NaN | NaN | NaN |
| Survey mean consumption or income per capita, total population (2011 PPP $ per day) | NaN | NaN | NaN | NaN | NaN | NaN | NaN | NaN | NaN | NaN | ... | NaN | NaN | 6.92 | NaN | NaN | 7.46 | NaN | NaN | NaN | NaN |
| Annualized average growth rate in per capita real survey mean consumption or income, bottom 40% of population (%) | NaN | NaN | NaN | NaN | NaN | NaN | NaN | NaN | NaN | NaN | ... | NaN | NaN | NaN | NaN | NaN | 5.12 | NaN | NaN | NaN | NaN |
5 rows × 60 columns
# Transpose
data = data.T
data.tail()
| Indicator Name | Child employment in agriculture, male (% of male economically active children ages 7-14) | Child employment in agriculture, female (% of female economically active children ages 7-14) | Annualized average growth rate in per capita real survey mean consumption or income, total population (%) | Survey mean consumption or income per capita, total population (2011 PPP $ per day) | Annualized average growth rate in per capita real survey mean consumption or income, bottom 40% of population (%) | Survey mean consumption or income per capita, bottom 40% of population (2011 PPP $ per day) | Average transaction cost of sending remittances from a specific country (%) | Average transaction cost of sending remittances to a specific country (%) | Urban poverty headcount ratio at national poverty lines (% of urban population) | Urban poverty gap at national poverty lines (%) | ... | Net official flows from UN agencies, UNAIDS (current US$) | Net financial flows, RDB nonconcessional (NFL, current US$) | Net financial flows, RDB concessional (NFL, current US$) | PPG, private creditors (NFL, current US$) | PPG, other private creditors (NFL, current US$) | PNG, commercial banks and other creditors (NFL, current US$) | PNG, bonds (NFL, current US$) | Commercial banks and other lending (PPG + PNG) (NFL, current US$) | PPG, commercial banks (NFL, current US$) | PPG, bonds (NFL, current US$) |
|---|---|---|---|---|---|---|---|---|---|---|---|---|---|---|---|---|---|---|---|---|---|
| 2015 | NaN | NaN | 2.56 | 7.46 | 5.12 | 2.79 | NaN | 6.248535 | NaN | NaN | ... | 350000.0 | 610131000.0 | -92764000.0 | 2.497690e+09 | -2025000.0 | 1.992369e+09 | -537502000.0 | 1.895185e+09 | -95159000.0 | 2.594874e+09 |
| 2016 | NaN | NaN | NaN | NaN | NaN | NaN | NaN | 5.727137 | NaN | NaN | ... | 330000.0 | 395910000.0 | -95158000.0 | -2.532091e+09 | -2256000.0 | -1.074806e+09 | -100000000.0 | -9.405240e+08 | 136538000.0 | -2.666373e+09 |
| 2017 | NaN | NaN | NaN | NaN | NaN | NaN | NaN | 5.462566 | NaN | NaN | ... | 190000.0 | 126293000.0 | -96047000.0 | 3.258590e+08 | -2225000.0 | -6.331680e+08 | 700000000.0 | -6.780710e+08 | -42678000.0 | 3.707620e+08 |
| 2018 | NaN | NaN | NaN | NaN | NaN | NaN | NaN | NaN | NaN | NaN | ... | NaN | 401180000.0 | -82567000.0 | 2.587989e+09 | -2219000.0 | -1.538270e+08 | 725000000.0 | -1.845860e+08 | -28540000.0 | 2.618748e+09 |
| 2019 | NaN | NaN | NaN | NaN | NaN | NaN | NaN | NaN | NaN | NaN | ... | NaN | NaN | NaN | NaN | NaN | NaN | NaN | NaN | NaN | NaN |
5 rows × 1429 columns
#Basic plotting
indicator = 'Population, total'
data[indicator].plot(grid=True, figsize=(14,8), title=indicator, lw = 4, marker='.', markersize=20)
<matplotlib.axes._subplots.AxesSubplot at 0x7f918be63710>
indicators = ['Population, total','Population, male','Population, female']
data[indicators].plot(grid=True, figsize=(14,8), title=indicator, lw = 4, marker='.', markersize=16)
<matplotlib.axes._subplots.AxesSubplot at 0x7f919085b950>

data[indicators].plot(grid=True, figsize=(16,8), kind='bar')
<matplotlib.axes._subplots.AxesSubplot at 0x7f918bfa1e90>
-mkc
Written on February 12, 2020