
Plot Entropy
“My greatest concern was what to call it. I thought of calling it ‘information,’ but the word was overly used, so I decided to call it ‘uncertainty.’ When I discussed it with John von Neumann, he had a better idea. Von Neumann told me, ‘You should call it entropy, for two reasons. In the first place your uncertainty function has been used in statistical mechanics under that name, so it already has a name. In the second place, and more important, no one really knows what entropy really is, so in a debate you will always have the advantage.”
Claude Elwood Shannon
Entropy
Image entropy, $ H_e $, is a quantity which is used to describe the amount of information coded in an image. If an image has $ G $ gray levels and the probability of gray level $ k $ is $ P(k) $, then, the entropy $ H_e $ is defined as
The probability of ocurrence of gray level, $P(k)$, can be estimated as
where $h(k)$ is the frequency of gray level $k$ in an $M \times N$ image, $0 \le k \le 2^b - 1$, with $b$ as the smallest number of bits with which the image quantization levels can be represented.
Thus, the entropy can be estimated as
from skimage.filters.rank import entropy
from skimage.morphology import disk
from skimage.color import rgb2gray
from skimage import io
from skimage import img_as_float

import matplotlib.pyplot as plt

%matplotlib inline
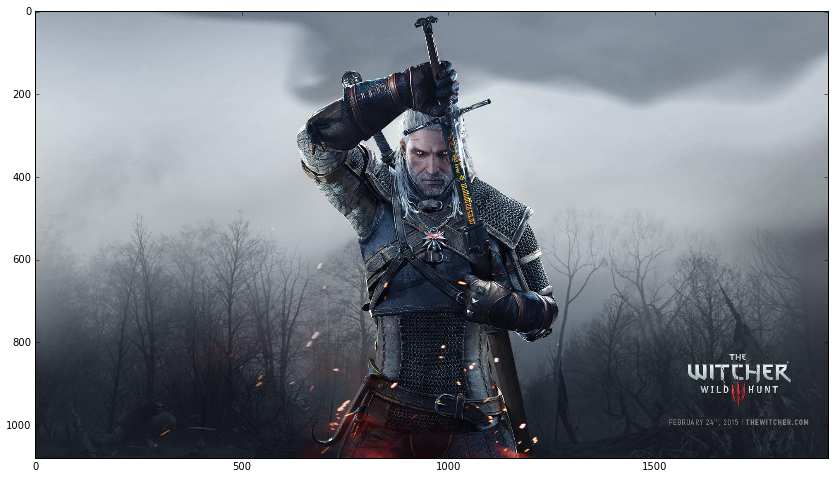
Input image:
src = io.imread('/home/cobalt/Pictures/geralt.jpg')
plt.figure(figsize = (16,8))
plt.imshow(src);
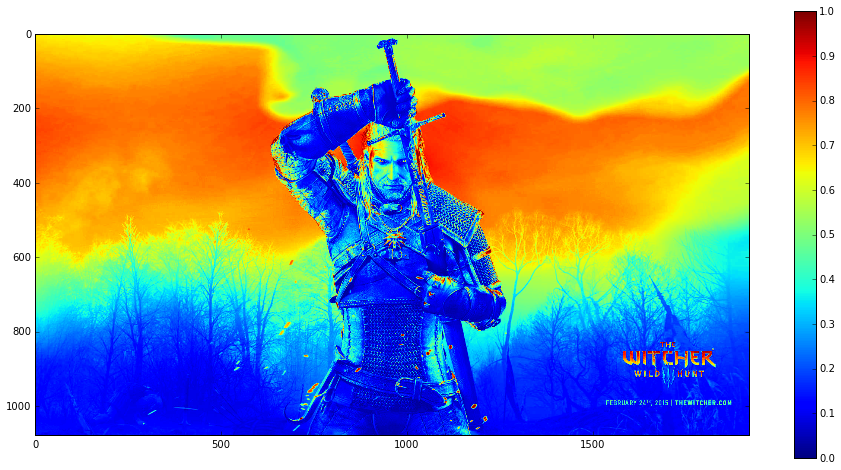
Convert src image to grayscale:
gray_image = img_as_float(rgb2gray(src))
fig = plt.figure(figsize = (16,8))
plt.imshow(gray_image); # in JET Colormap
plt.colorbar();
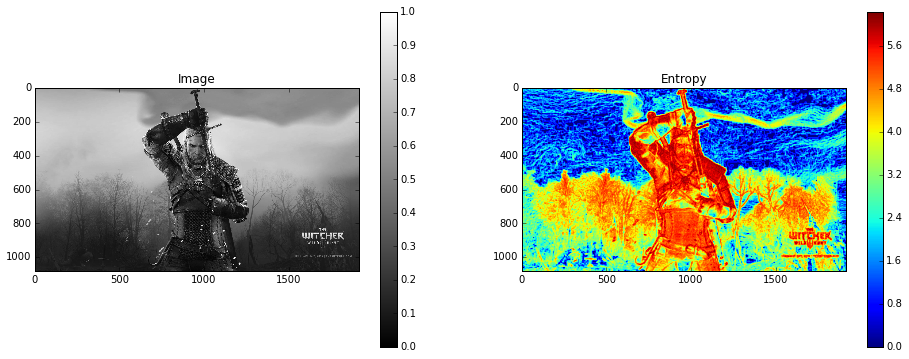
fig, (ax0, ax1) = plt.subplots(ncols=2, figsize=(16, 6))

img0 = ax0.imshow(gray_image, cmap=plt.cm.gray)
ax0.set_title('Image')
fig.colorbar(img0, ax=ax0)

img1 = ax1.imshow(entropy(gray_image, disk(5)), cmap=plt.cm.jet)
ax1.set_title('Entropy')
fig.colorbar(img1, ax=ax1)

plt.show();
By: Melvin Cabatuan melvincabatuan@gmail.com
This ipython notebook is licensed under the CC-BY-NC-SA license: http://creativecommons.org/licenses/by-nc-sa/4.0/

References:

    [1] http://scikit-image.org/docs/dev/auto_examples/plot_entropy.html