Covid19 Data Input And Visualization
Data Source
Novel Coronavirus (COVID-19) Cases, provided by JHU CSSE: https://github.com/CSSEGISandData/COVID-19
import pandas as pd
import numpy as np
import matplotlib.pyplot as plt
import random
Import Data from COVID-19 time series
https://github.com/CSSEGISandData/COVID-19/tree/master/csse_covid_19_data/csse_covid_19_time_series
confirmed_df  = pd.read_csv('https://raw.githubusercontent.com/CSSEGISandData/COVID-19/master/csse_covid_19_data/csse_covid_19_time_series/time_series_covid19_confirmed_global.csv')
deaths_df     = pd.read_csv('https://raw.githubusercontent.com/CSSEGISandData/COVID-19/master/csse_covid_19_data/csse_covid_19_time_series/time_series_covid19_deaths_global.csv')
recoveries_df = pd.read_csv('https://raw.githubusercontent.com/CSSEGISandData/COVID-19/master/csse_covid_19_data/csse_covid_19_time_series/time_series_covid19_recovered_global.csv')
COVID-19 Daily Reports
https://github.com/CSSEGISandData/COVID-19/tree/master/csse_covid_19_data/csse_covid_19_daily_reports
latest_data = pd.read_csv('https://raw.githubusercontent.com/CSSEGISandData/COVID-19/master/csse_covid_19_data/csse_covid_19_daily_reports/04-16-2020.csv')
latest_data.describe()
| FIPS | Lat | Long_ | Confirmed | Deaths | Recovered | Active | |
|---|---|---|---|---|---|---|---|
| count | 2774.000000 | 2982.000000 | 2982.000000 | 3041.000000 | 3041.000000 | 3041.000000 | 3041.000000 |
| mean | 31274.175919 | 36.653580 | -80.998891 | 707.874712 | 47.287405 | 178.266031 | 482.321276 |
| std | 17268.589814 | 9.926478 | 40.254442 | 7132.717652 | 726.392449 | 2862.257922 | 4692.124431 |
| min | 66.000000 | -51.796300 | -164.035380 | 0.000000 | 0.000000 | 0.000000 | -54703.000000 |
| 25% | 18103.500000 | 33.780007 | -95.769967 | 4.000000 | 0.000000 | 0.000000 | 4.000000 |
| 50% | 29142.000000 | 37.843679 | -87.469020 | 16.000000 | 0.000000 | 0.000000 | 15.000000 |
| 75% | 46086.500000 | 41.517404 | -81.090960 | 79.000000 | 3.000000 | 0.000000 | 69.000000 |
| max | 99999.000000 | 71.706900 | 178.065000 | 184948.000000 | 22170.000000 | 77000.000000 | 111669.000000 |
latest_data.head()
| FIPS | Admin2 | Province_State | Country_Region | Last_Update | Lat | Long_ | Confirmed | Deaths | Recovered | Active | Combined_Key | |
|---|---|---|---|---|---|---|---|---|---|---|---|---|
| 0 | 45001.0 | Abbeville | South Carolina | US | 2020-04-16 23:30:51 | 34.223334 | -82.461707 | 10 | 0 | 0 | 10 | Abbeville, South Carolina, US |
| 1 | 22001.0 | Acadia | Louisiana | US | 2020-04-16 23:30:51 | 30.295065 | -92.414197 | 108 | 6 | 0 | 102 | Acadia, Louisiana, US |
| 2 | 51001.0 | Accomack | Virginia | US | 2020-04-16 23:30:51 | 37.767072 | -75.632346 | 19 | 0 | 0 | 19 | Accomack, Virginia, US |
| 3 | 16001.0 | Ada | Idaho | US | 2020-04-16 23:30:51 | 43.452658 | -116.241552 | 567 | 9 | 0 | 558 | Ada, Idaho, US |
| 4 | 19001.0 | Adair | Iowa | US | 2020-04-16 23:30:51 | 41.330756 | -94.471059 | 1 | 0 | 0 | 1 | Adair, Iowa, US |
Get all the dates for the pandemic data
cols = confirmed_df.keys()
cols
Index(['Province/State', 'Country/Region', 'Lat', 'Long', '1/22/20', '1/23/20',
       '1/24/20', '1/25/20', '1/26/20', '1/27/20', '1/28/20', '1/29/20',
       '1/30/20', '1/31/20', '2/1/20', '2/2/20', '2/3/20', '2/4/20', '2/5/20',
       '2/6/20', '2/7/20', '2/8/20', '2/9/20', '2/10/20', '2/11/20', '2/12/20',
       '2/13/20', '2/14/20', '2/15/20', '2/16/20', '2/17/20', '2/18/20',
       '2/19/20', '2/20/20', '2/21/20', '2/22/20', '2/23/20', '2/24/20',
       '2/25/20', '2/26/20', '2/27/20', '2/28/20', '2/29/20', '3/1/20',
       '3/2/20', '3/3/20', '3/4/20', '3/5/20', '3/6/20', '3/7/20', '3/8/20',
       '3/9/20', '3/10/20', '3/11/20', '3/12/20', '3/13/20', '3/14/20',
       '3/15/20', '3/16/20', '3/17/20', '3/18/20', '3/19/20', '3/20/20',
       '3/21/20', '3/22/20', '3/23/20', '3/24/20', '3/25/20', '3/26/20',
       '3/27/20', '3/28/20', '3/29/20', '3/30/20', '3/31/20', '4/1/20',
       '4/2/20', '4/3/20', '4/4/20', '4/5/20', '4/6/20', '4/7/20', '4/8/20',
       '4/9/20', '4/10/20', '4/11/20', '4/12/20', '4/13/20', '4/14/20',
       '4/15/20', '4/16/20', '4/17/20'],
      dtype='object')
# Printing the dates ONLY
cols[4:]
Index(['1/22/20', '1/23/20', '1/24/20', '1/25/20', '1/26/20', '1/27/20',
       '1/28/20', '1/29/20', '1/30/20', '1/31/20', '2/1/20', '2/2/20',
       '2/3/20', '2/4/20', '2/5/20', '2/6/20', '2/7/20', '2/8/20', '2/9/20',
       '2/10/20', '2/11/20', '2/12/20', '2/13/20', '2/14/20', '2/15/20',
       '2/16/20', '2/17/20', '2/18/20', '2/19/20', '2/20/20', '2/21/20',
       '2/22/20', '2/23/20', '2/24/20', '2/25/20', '2/26/20', '2/27/20',
       '2/28/20', '2/29/20', '3/1/20', '3/2/20', '3/3/20', '3/4/20', '3/5/20',
       '3/6/20', '3/7/20', '3/8/20', '3/9/20', '3/10/20', '3/11/20', '3/12/20',
       '3/13/20', '3/14/20', '3/15/20', '3/16/20', '3/17/20', '3/18/20',
       '3/19/20', '3/20/20', '3/21/20', '3/22/20', '3/23/20', '3/24/20',
       '3/25/20', '3/26/20', '3/27/20', '3/28/20', '3/29/20', '3/30/20',
       '3/31/20', '4/1/20', '4/2/20', '4/3/20', '4/4/20', '4/5/20', '4/6/20',
       '4/7/20', '4/8/20', '4/9/20', '4/10/20', '4/11/20', '4/12/20',
       '4/13/20', '4/14/20', '4/15/20', '4/16/20', '4/17/20'],
      dtype='object')
Get the COVID-19 confirmed-deaths-recoveries data
confirmed  = confirmed_df.loc[:, cols[4]:]
deaths     = deaths_df.loc[:, cols[4]:]
recoveries = recoveries_df.loc[:, cols[4]:]
confirmed.head()
| 1/22/20 | 1/23/20 | 1/24/20 | 1/25/20 | 1/26/20 | 1/27/20 | 1/28/20 | 1/29/20 | 1/30/20 | 1/31/20 | ... | 4/8/20 | 4/9/20 | 4/10/20 | 4/11/20 | 4/12/20 | 4/13/20 | 4/14/20 | 4/15/20 | 4/16/20 | 4/17/20 | |
|---|---|---|---|---|---|---|---|---|---|---|---|---|---|---|---|---|---|---|---|---|---|
| 0 | 0 | 0 | 0 | 0 | 0 | 0 | 0 | 0 | 0 | 0 | ... | 444 | 484 | 521 | 555 | 607 | 665 | 714 | 784 | 840 | 906 |
| 1 | 0 | 0 | 0 | 0 | 0 | 0 | 0 | 0 | 0 | 0 | ... | 400 | 409 | 416 | 433 | 446 | 467 | 475 | 494 | 518 | 539 |
| 2 | 0 | 0 | 0 | 0 | 0 | 0 | 0 | 0 | 0 | 0 | ... | 1572 | 1666 | 1761 | 1825 | 1914 | 1983 | 2070 | 2160 | 2268 | 2418 |
| 3 | 0 | 0 | 0 | 0 | 0 | 0 | 0 | 0 | 0 | 0 | ... | 564 | 583 | 601 | 601 | 638 | 646 | 659 | 673 | 673 | 696 |
| 4 | 0 | 0 | 0 | 0 | 0 | 0 | 0 | 0 | 0 | 0 | ... | 19 | 19 | 19 | 19 | 19 | 19 | 19 | 19 | 19 | 19 |
5 rows × 87 columns
# RECALL
confirmed_df.head()
| Province/State | Country/Region | Lat | Long | 1/22/20 | 1/23/20 | 1/24/20 | 1/25/20 | 1/26/20 | 1/27/20 | ... | 4/8/20 | 4/9/20 | 4/10/20 | 4/11/20 | 4/12/20 | 4/13/20 | 4/14/20 | 4/15/20 | 4/16/20 | 4/17/20 | |
|---|---|---|---|---|---|---|---|---|---|---|---|---|---|---|---|---|---|---|---|---|---|
| 0 | NaN | Afghanistan | 33.0000 | 65.0000 | 0 | 0 | 0 | 0 | 0 | 0 | ... | 444 | 484 | 521 | 555 | 607 | 665 | 714 | 784 | 840 | 906 |
| 1 | NaN | Albania | 41.1533 | 20.1683 | 0 | 0 | 0 | 0 | 0 | 0 | ... | 400 | 409 | 416 | 433 | 446 | 467 | 475 | 494 | 518 | 539 |
| 2 | NaN | Algeria | 28.0339 | 1.6596 | 0 | 0 | 0 | 0 | 0 | 0 | ... | 1572 | 1666 | 1761 | 1825 | 1914 | 1983 | 2070 | 2160 | 2268 | 2418 |
| 3 | NaN | Andorra | 42.5063 | 1.5218 | 0 | 0 | 0 | 0 | 0 | 0 | ... | 564 | 583 | 601 | 601 | 638 | 646 | 659 | 673 | 673 | 696 |
| 4 | NaN | Angola | -11.2027 | 17.8739 | 0 | 0 | 0 | 0 | 0 | 0 | ... | 19 | 19 | 19 | 19 | 19 | 19 | 19 | 19 | 19 | 19 |
5 rows × 91 columns
dates = confirmed.keys()
world_cases     = [confirmed[i].sum() for i in dates]
total_deaths    = [deaths[i].sum() for i in dates]
total_recovered = [recoveries[i].sum() for i in dates]
total_active = (np.array(world_cases)-np.array(total_deaths)-np.array(total_recovered)).tolist()
mortality_rate  = (np.array(total_deaths)/np.array(world_cases)).tolist()
recovery_rate   = (np.array(total_recovered)/np.array(world_cases)).tolist()
Convert time string to actual datetime objects
import datetime

start = '1/22/2020'
start_date = datetime.datetime.strptime(start, '%m/%d/%Y')
dates_dt = [(start_date + datetime.timedelta(days=i)).strftime('%m/%d/%Y') for i in range(len(dates))]
Plot Coronavirus Over Time
covid_df = pd.DataFrame(
    {'Confirmed': world_cases,
     'Deaths'   : total_deaths,
     'Recovered': total_recovered,
     'Active'   : total_active
    }, index=dates_dt)
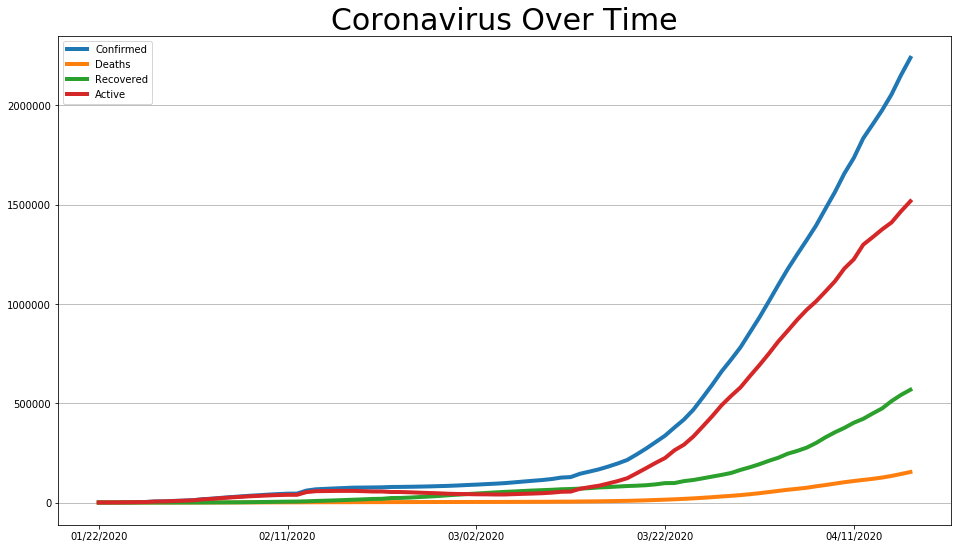
covid_df.plot(figsize=(16, 9), linewidth=4).grid(axis='y')
plt.title('Coronavirus Over Time', size=30);
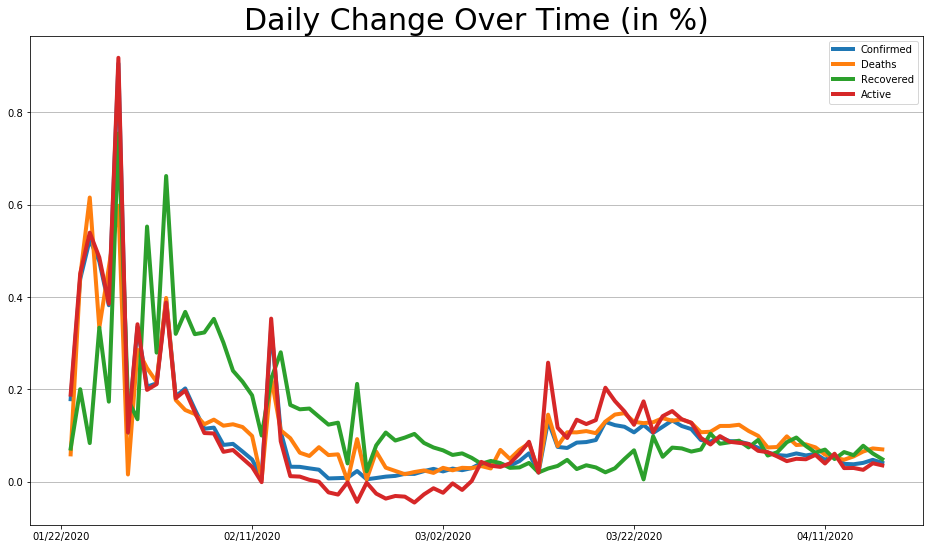
covid_df.pct_change().plot(figsize=(16, 9), linewidth=4).grid(axis='y')
plt.title('Daily Change Over Time (in %)', size=30);
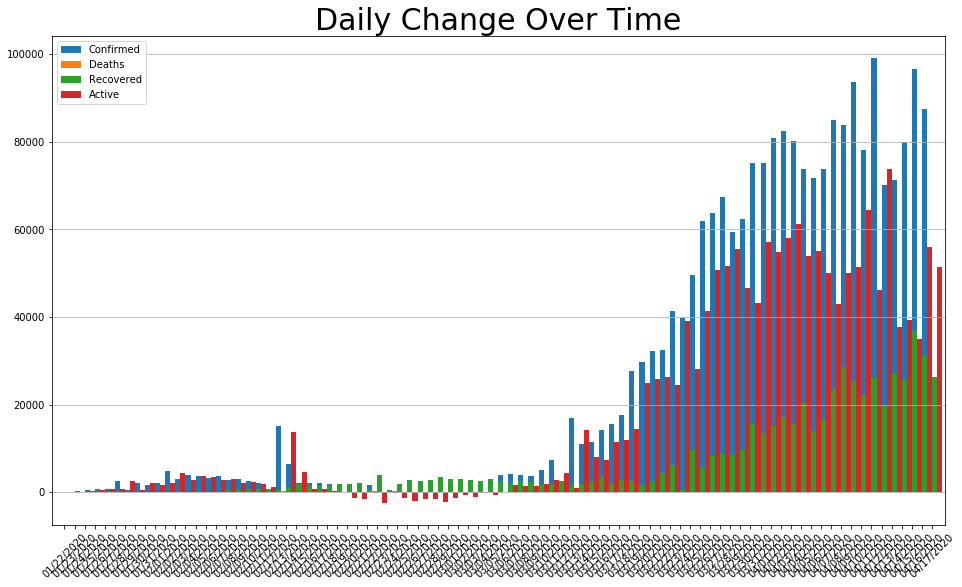
daily_change = covid_df.diff()
daily_change.plot.bar(figsize=(16, 9), linewidth=4, width=2).grid(axis='y')
plt.title('Daily Change Over Time', size=30)
plt.xticks(rotation=45);
daily_change.columns
Index(['Confirmed', 'Deaths', 'Recovered', 'Active'], dtype='object')
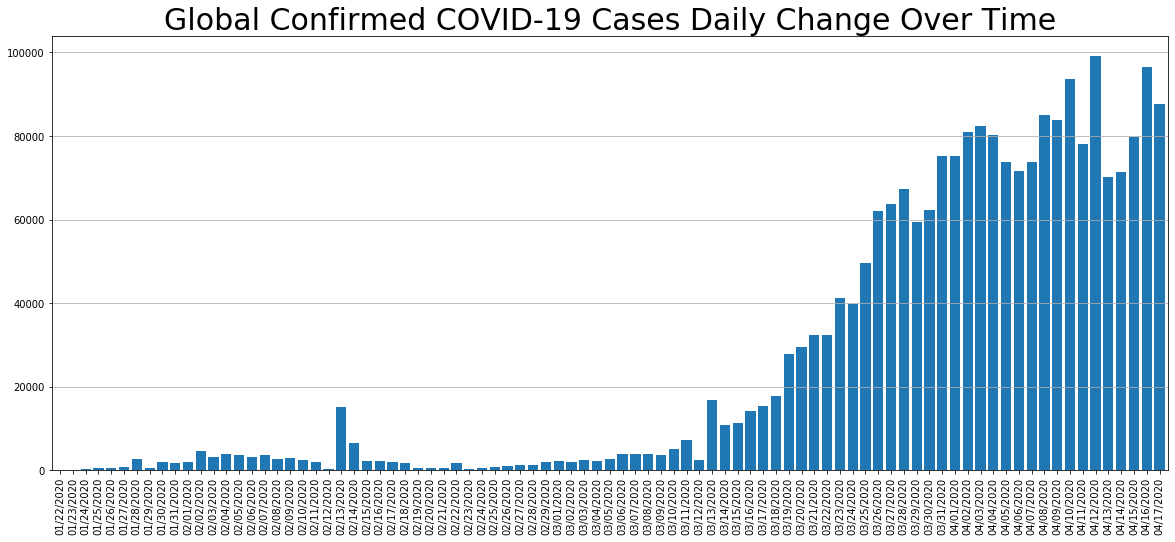
daily_change.Confirmed.plot.bar(figsize=(20, 8), linewidth=4, width=0.8).grid(axis='y')
plt.title('Global Confirmed COVID-19 Cases Daily Change Over Time', size=30)
#plt.xticks(rotation=45);
Text(0.5, 1.0, 'Global Confirmed COVID-19 Cases Daily Change Over Time')
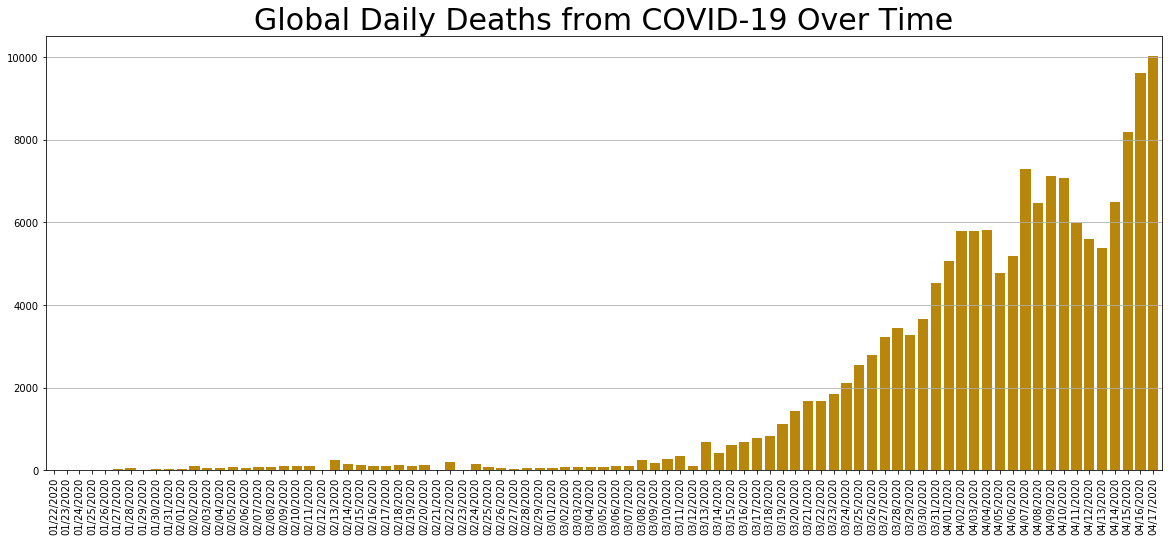
daily_change.Deaths.plot.bar(figsize=(20, 8), linewidth=4, width=0.8, color='darkgoldenrod').grid(axis='y')
plt.title('Global Daily Deaths from COVID-19 Over Time', size=30);
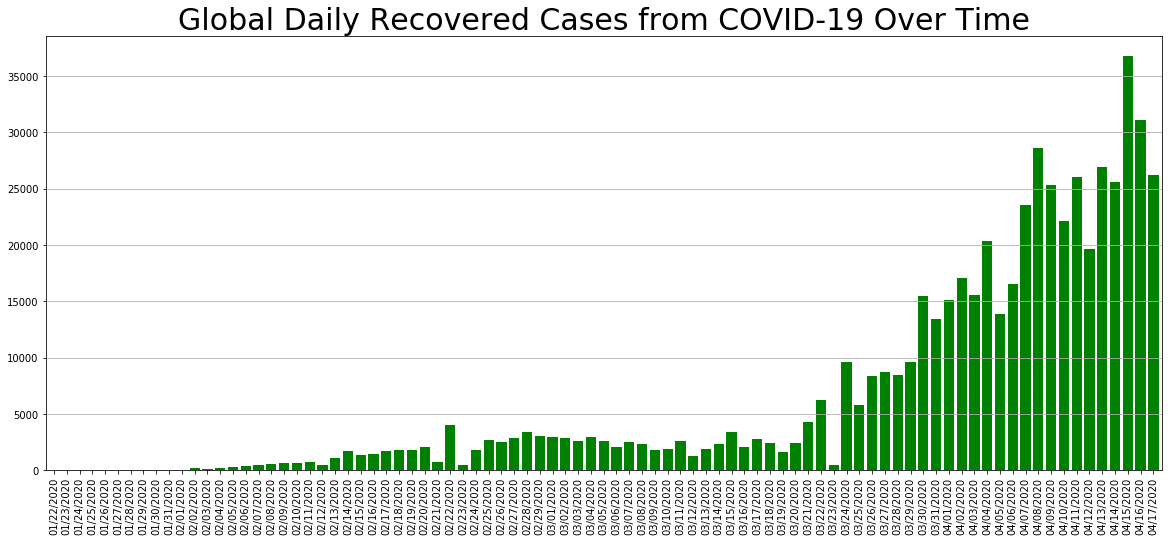
daily_change.Recovered.plot.bar(figsize=(20, 8), linewidth=4, width=0.8, color='green').grid(axis='y')
plt.title('Global Daily Recovered Cases from COVID-19 Over Time', size=30);
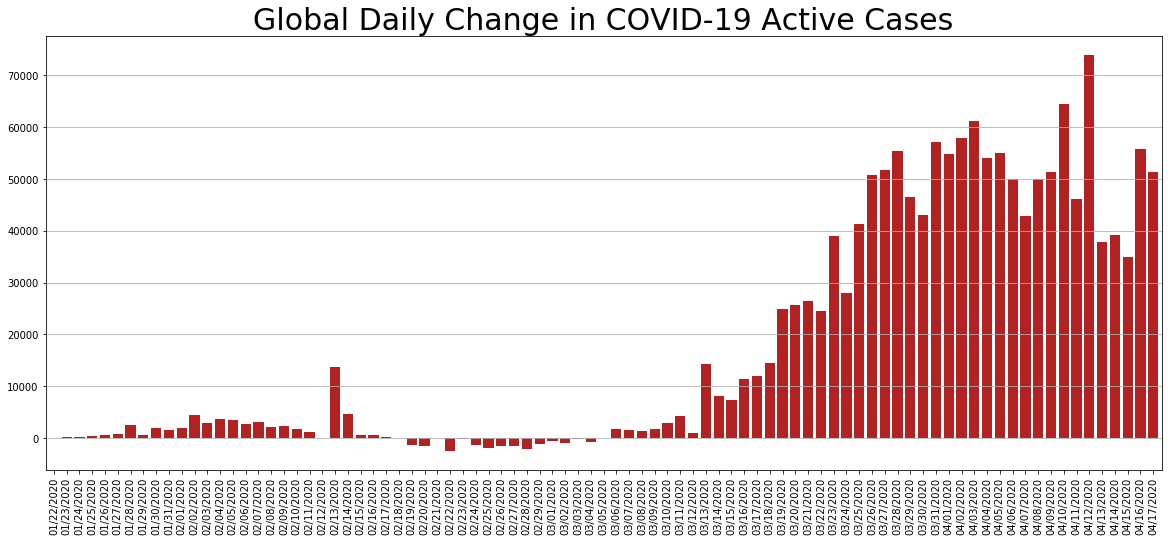
daily_change.Active.plot.bar(figsize=(20, 8), linewidth=4, width=0.8, color='firebrick').grid(axis='y')
plt.title('Global Daily Change in COVID-19 Active Cases', size=30);
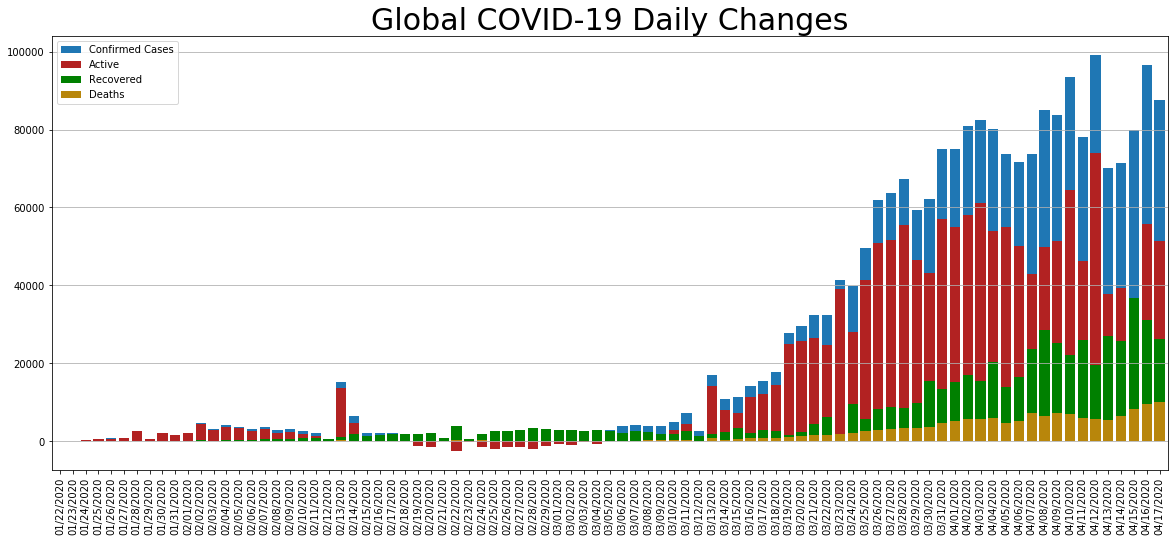
daily_change.Confirmed.plot.bar(figsize=(20, 8), linewidth=4, width=0.8, label='Confirmed Cases', legend=True).grid(axis='y')
daily_change.Active.plot.bar(figsize=(20, 8), linewidth=4, width=0.8, color='firebrick', label='Active', legend=True).grid(axis='y')
daily_change.Recovered.plot.bar(figsize=(20, 8), linewidth=4, width=0.8, color='green', label='Recovered', legend=True).grid(axis='y')
daily_change.Deaths.plot.bar(figsize=(20, 8), linewidth=4, width=0.8, color='darkgoldenrod', label='Deaths', legend=True).grid(axis='y')
plt.title('Global COVID-19 Daily Changes', size=30);
def get_data(country):
    cases = [confirmed_df[confirmed_df['Country/Region']==country][i].sum() for i in dates]
    daily_increase = pd.Series(cases).diff().tolist()
    deaths = [deaths_df[deaths_df['Country/Region']==country][i].sum() for i in dates]
    daily_death = pd.Series(deaths).diff().tolist()
    recoveries  = [recoveries_df[recoveries_df['Country/Region']==country][i].sum() for i in dates]
    daily_recovery = pd.Series(recoveries).diff().tolist()
    return (cases, deaths, recoveries, daily_increase, daily_death, daily_recovery)

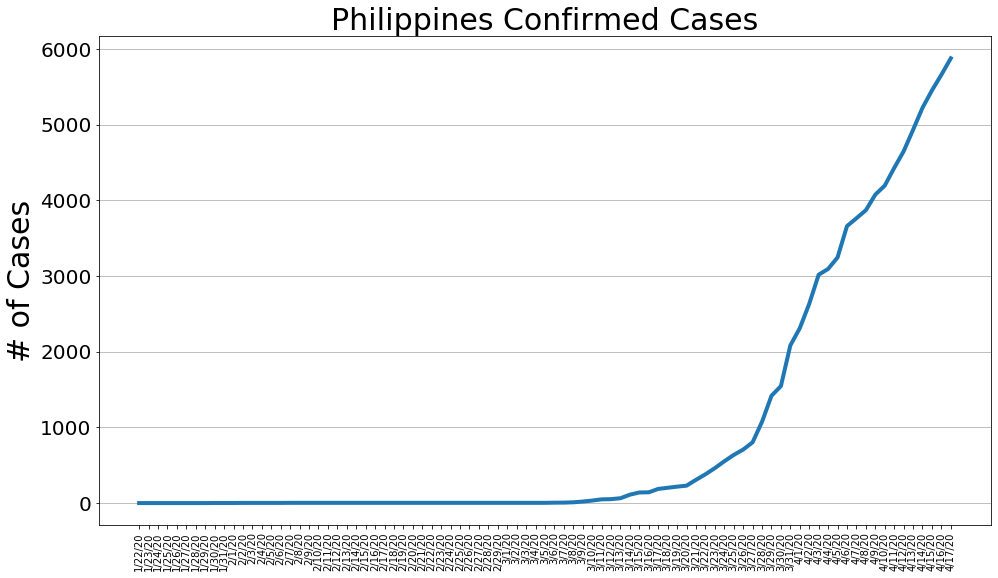
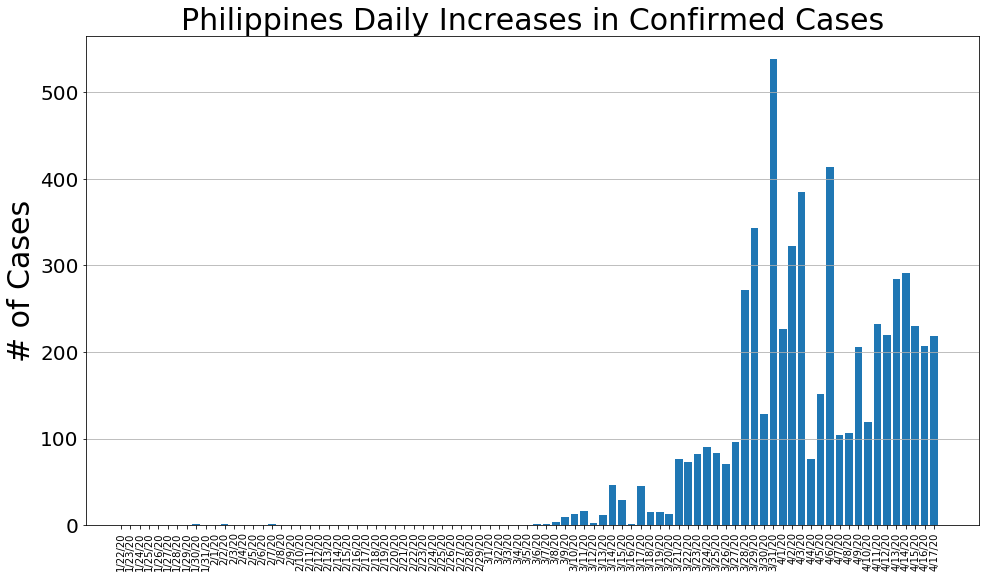
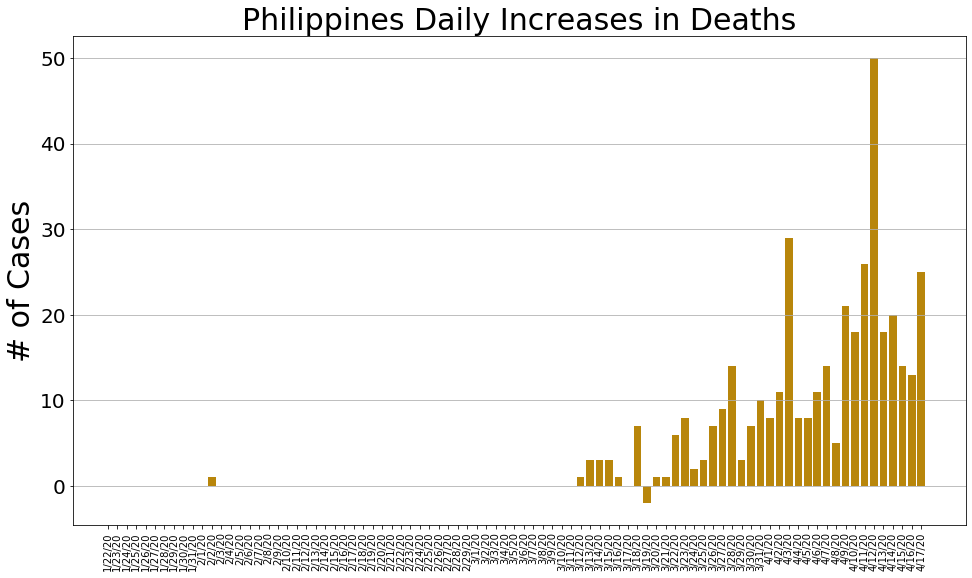
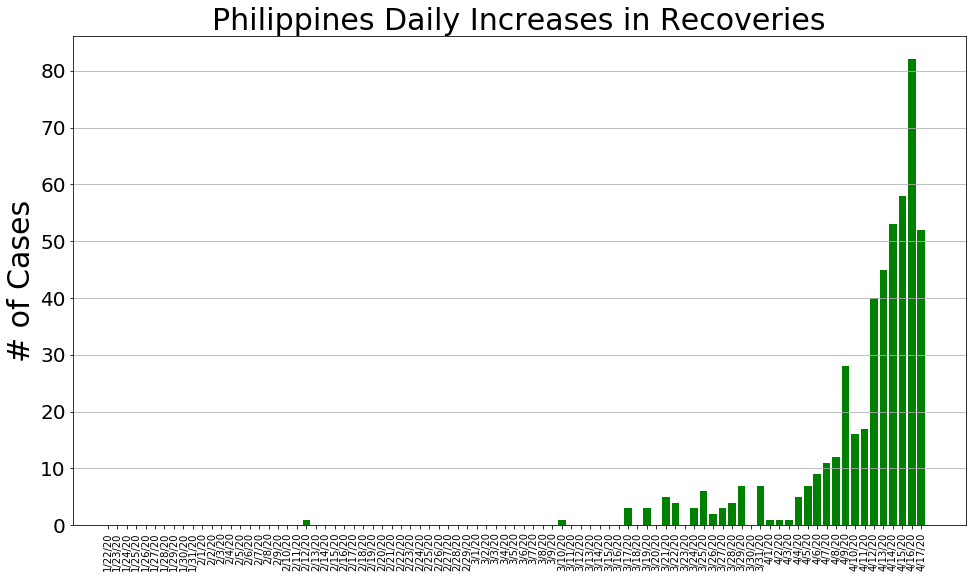
def country_plot(x, y1, y2, y3, y4, country):
    plt.figure(figsize=(16, 9))
    plt.plot(x, y1, linewidth=4)
    plt.title('{} Confirmed Cases'.format(country), size=30)
    plt.ylabel('# of Cases', size=30)
    plt.xticks(size=10)
    plt.xticks(rotation=90)
    plt.yticks(size=20)
    plt.grid(axis='y')
    plt.show()

    plt.figure(figsize=(16, 9))
    plt.bar(x, y2)
    plt.title('{} Daily Increases in Confirmed Cases'.format(country), size=30)
    plt.ylabel('# of Cases', size=30)
    plt.xticks(size=10)
    plt.xticks(rotation=90)
    plt.yticks(size=20)
    plt.grid(axis='y')
    plt.show()

    plt.figure(figsize=(16, 9))
    plt.bar(x, y3, color='darkgoldenrod')
    plt.title('{} Daily Increases in Deaths'.format(country), size=30)
    plt.ylabel('# of Cases', size=30)
    plt.xticks(size=10)
    plt.xticks(rotation=90)
    plt.yticks(size=20)
    plt.grid(axis='y')
    plt.show()

    plt.figure(figsize=(16, 9))
    plt.bar(x, y4, color='green')
    plt.title('{} Daily Increases in Recoveries'.format(country), size=30)
    plt.ylabel('# of Cases', size=30)
    plt.xticks(size=10)
    plt.xticks(rotation=90)
    plt.yticks(size=20)
    plt.grid(axis='y')
    plt.show()
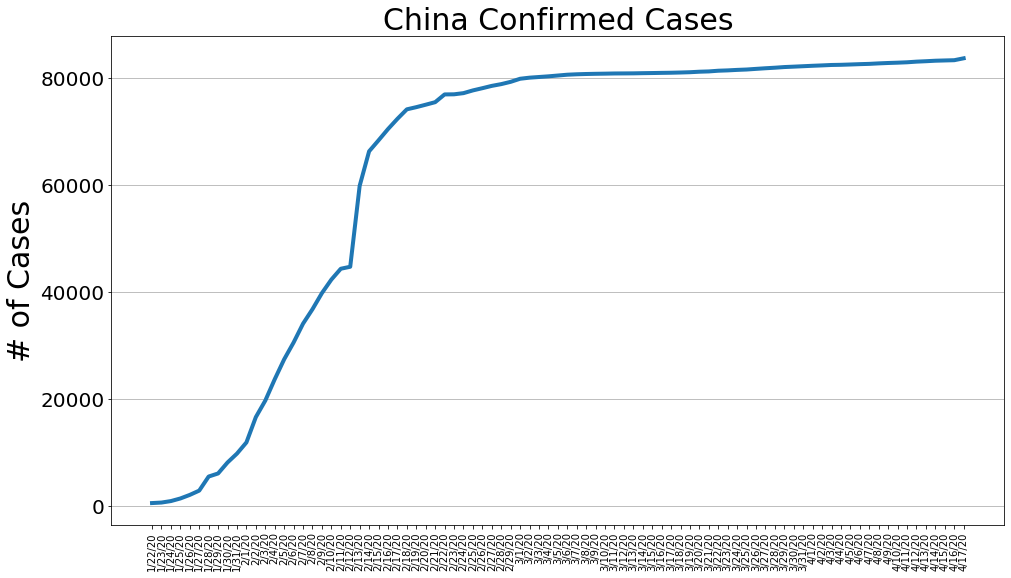
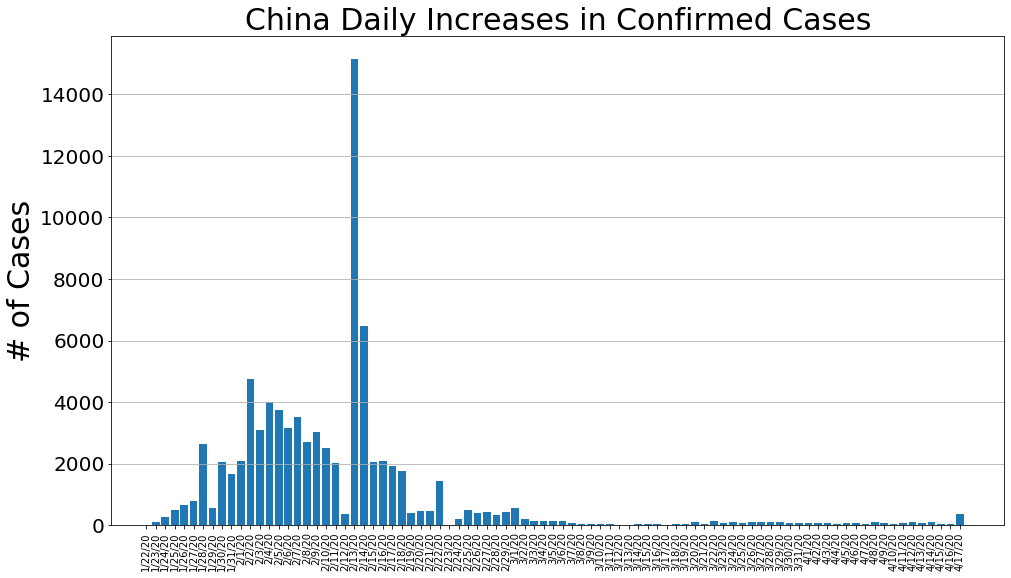
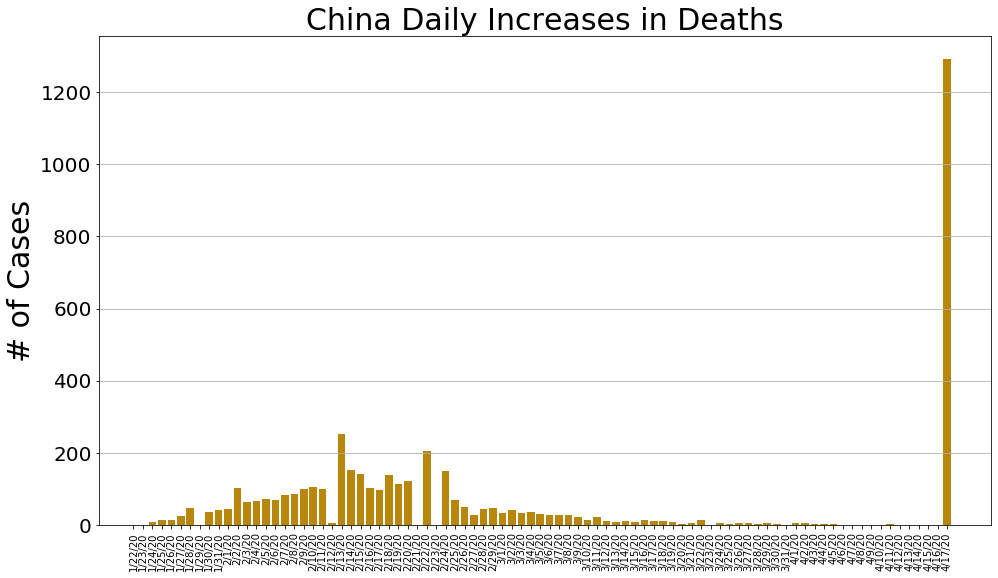
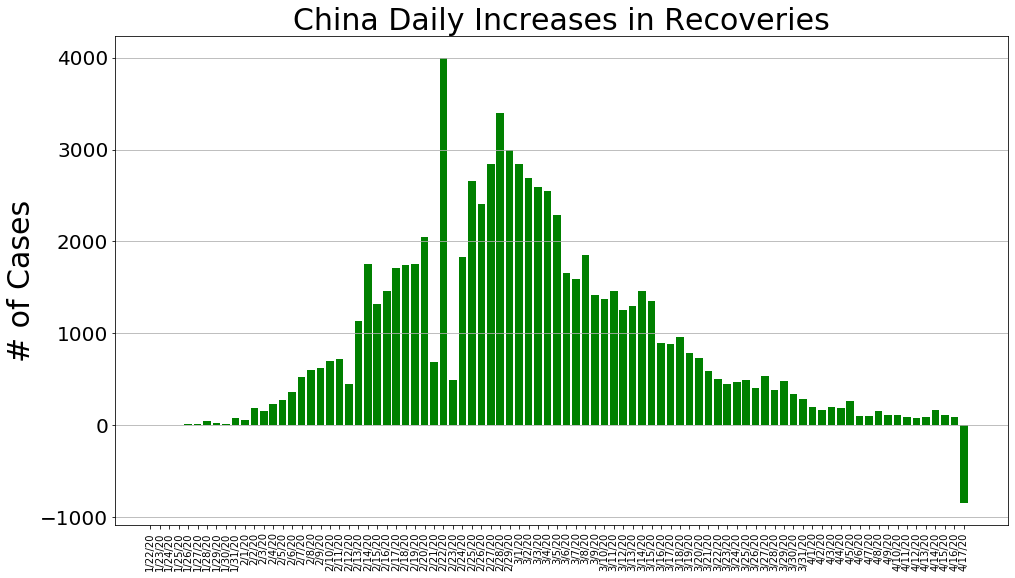
country = 'China'
china_cases, china_deaths, china_recoveries, daily_increase, daily_death,daily_recovery = get_data(country)
country_plot(dates, china_cases, daily_increase, daily_death, daily_recovery, country)
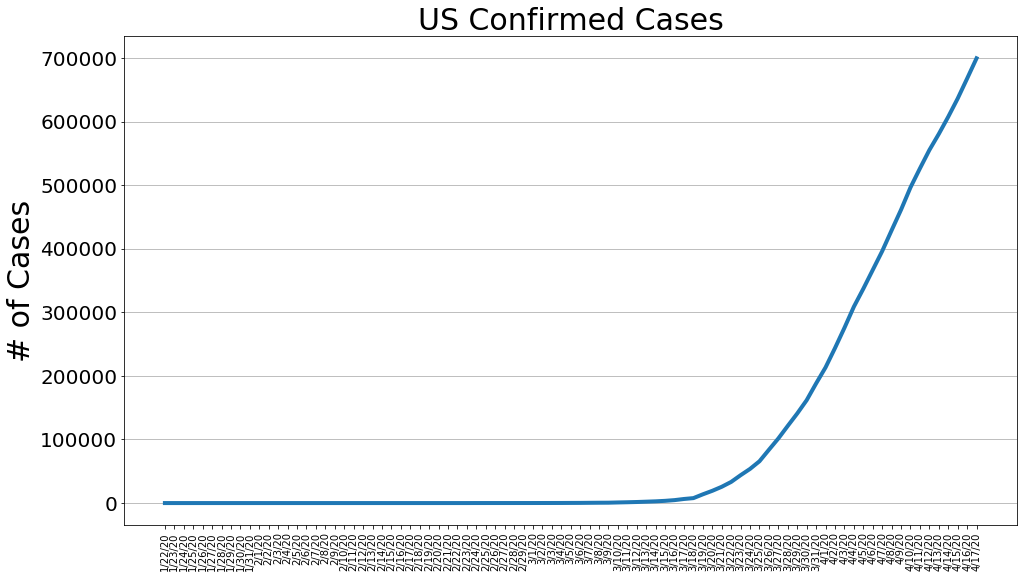
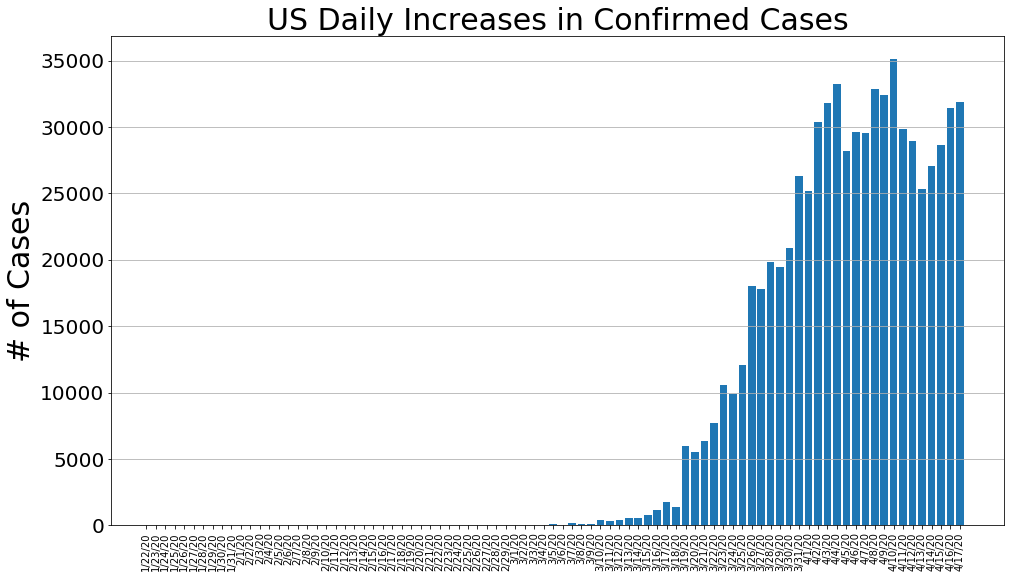
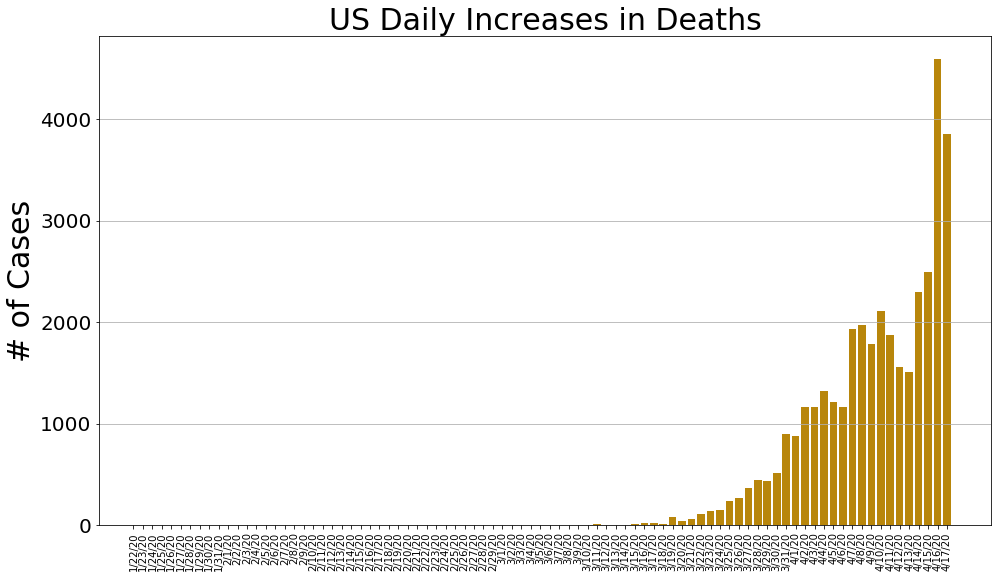
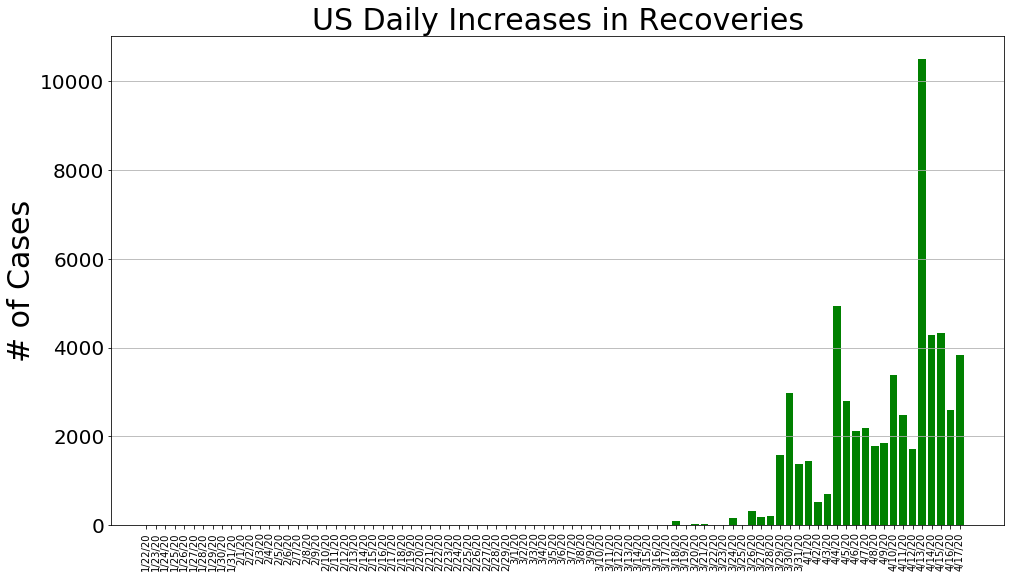
country = 'US'
us_cases, us_deaths, us_recoveries, daily_increase, daily_death,daily_recovery = get_data(country)
country_plot(dates, us_cases, daily_increase, daily_death, daily_recovery, country)
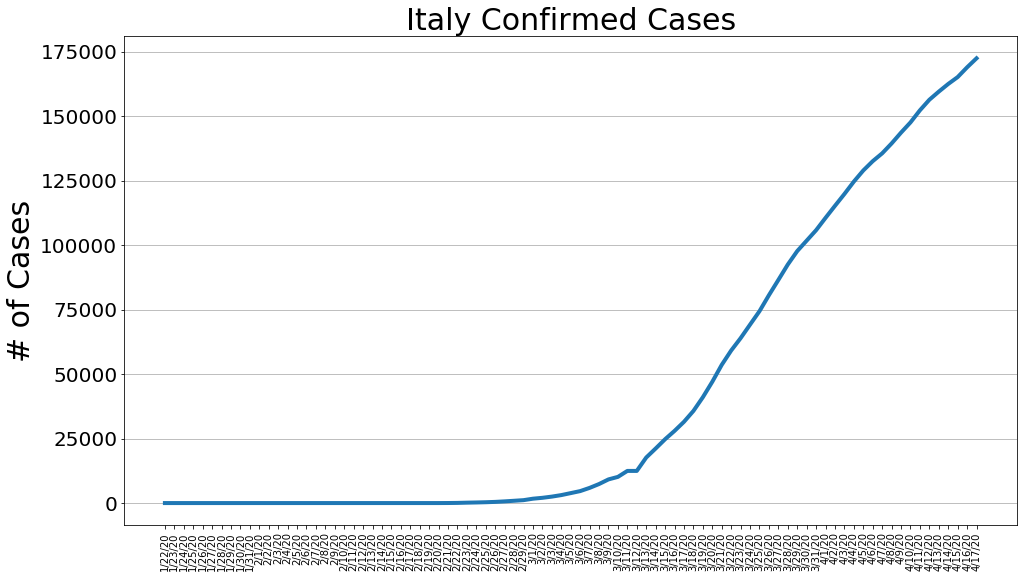
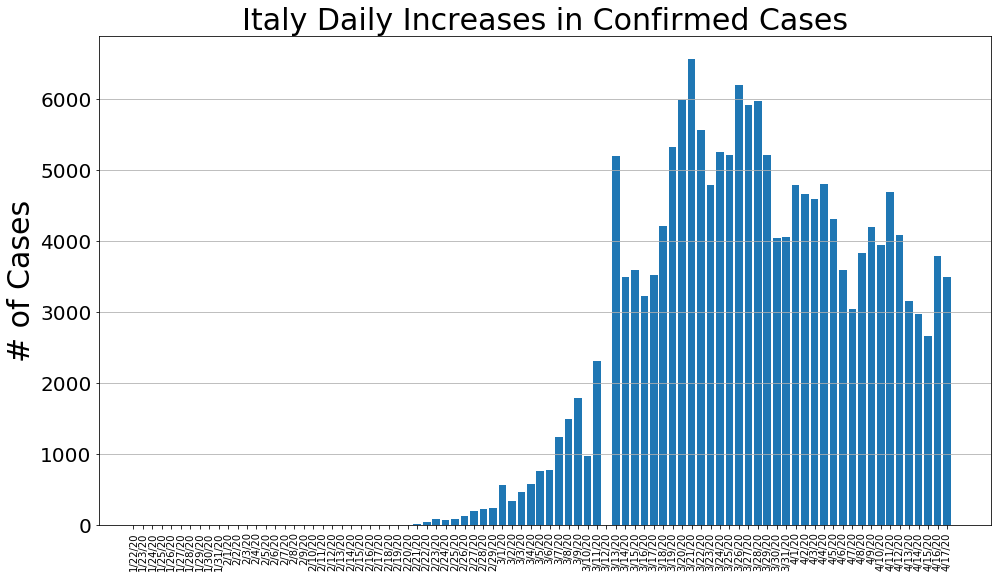
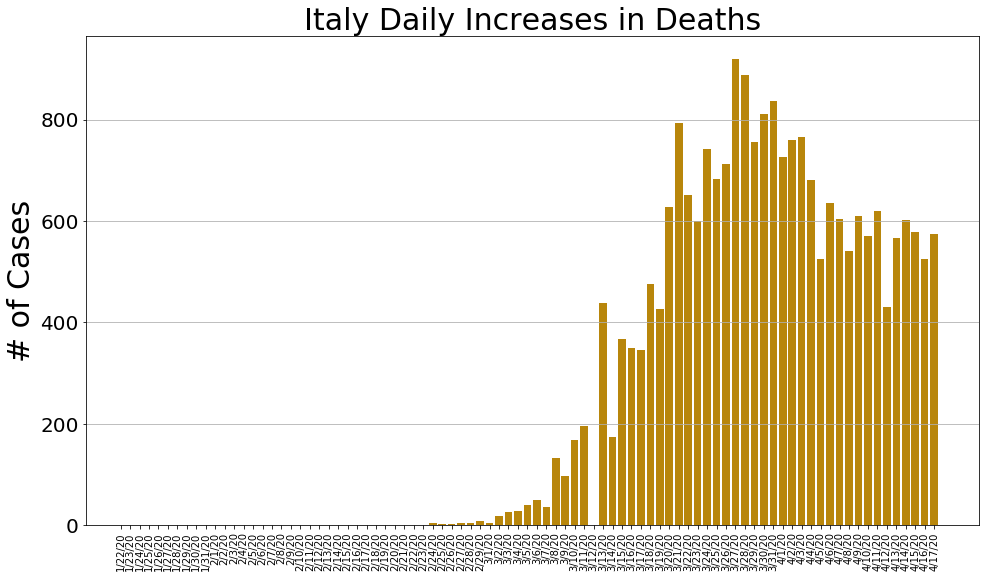
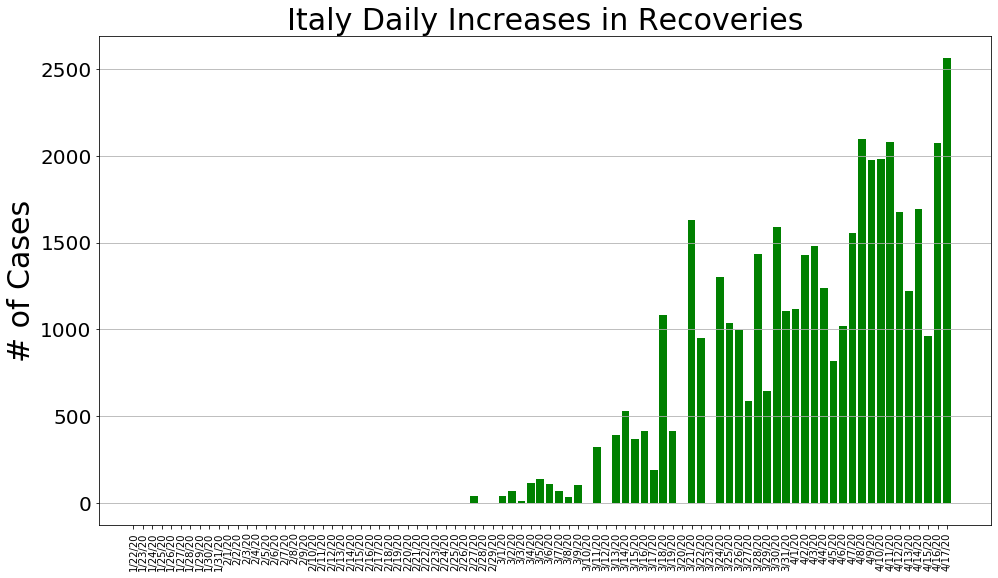
country = 'Italy'
italy_cases, italy_deaths, italy_recoveries, daily_increase, daily_death,daily_recovery = get_data(country)
country_plot(dates, italy_cases, daily_increase, daily_death, daily_recovery, country)
country = 'Spain'
spain_cases, spain_deaths, spain_recoveries, daily_increase, daily_death,daily_recovery = get_data(country)
# country_plot(dates, spain_cases, daily_increase, daily_death, daily_recovery, country)
country = 'France'
france_cases, france_deaths, france_recoveries, daily_increase, daily_death,daily_recovery = get_data(country)
# country_plot(dates, france_cases, daily_increase, daily_death, daily_recovery, country)
country = 'Germany'
germany_cases, germany_deaths, germany_recoveries, daily_increase, daily_death,daily_recovery = get_data(country)
# country_plot(dates, germany_cases, daily_increase, daily_death, daily_recovery, country)
country = 'Philippines'
philippine_cases, philippine_deaths, philippine_recoveries, daily_increase, daily_death,daily_recovery = get_data(country)
country_plot(dates, philippine_cases, daily_increase, daily_death, daily_recovery, country)
# philippine_cases, philippine_deaths, philippine_recoveries, daily_increase, daily_death,daily_recovery
philippine_total_active = (np.array(philippine_cases)-np.array(philippine_deaths)-np.array(philippine_recoveries)).tolist()
philippine_covid_df = pd.DataFrame(
    {'Confirmed': philippine_cases,
     'Deaths'   : philippine_deaths,
     'Recovered': philippine_recoveries,
     'Active'   : philippine_total_active
    }, index=dates_dt)
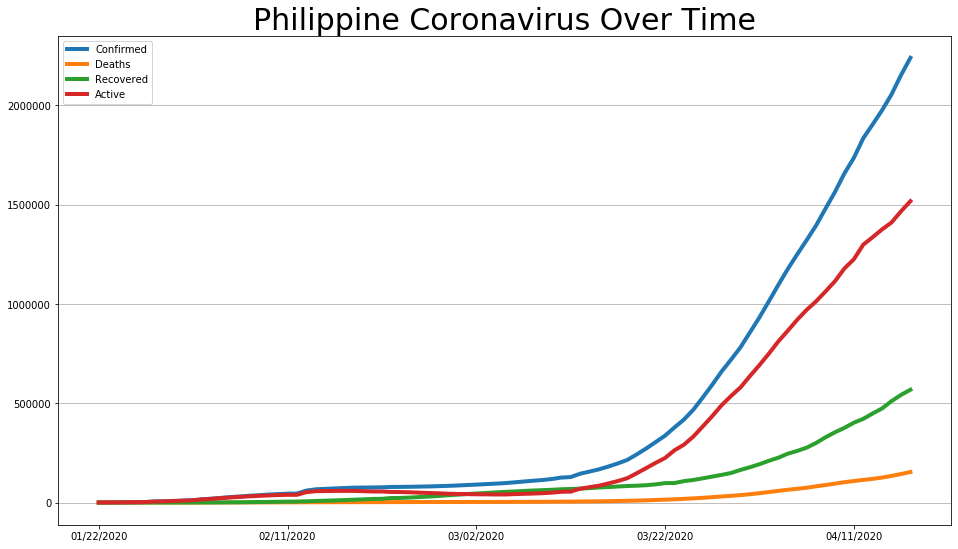
covid_df.plot(figsize=(16, 9), linewidth=4).grid(axis='y')
plt.title('Philippine Coronavirus Over Time', size=30);
ph_daily_change = philippine_covid_df.diff()
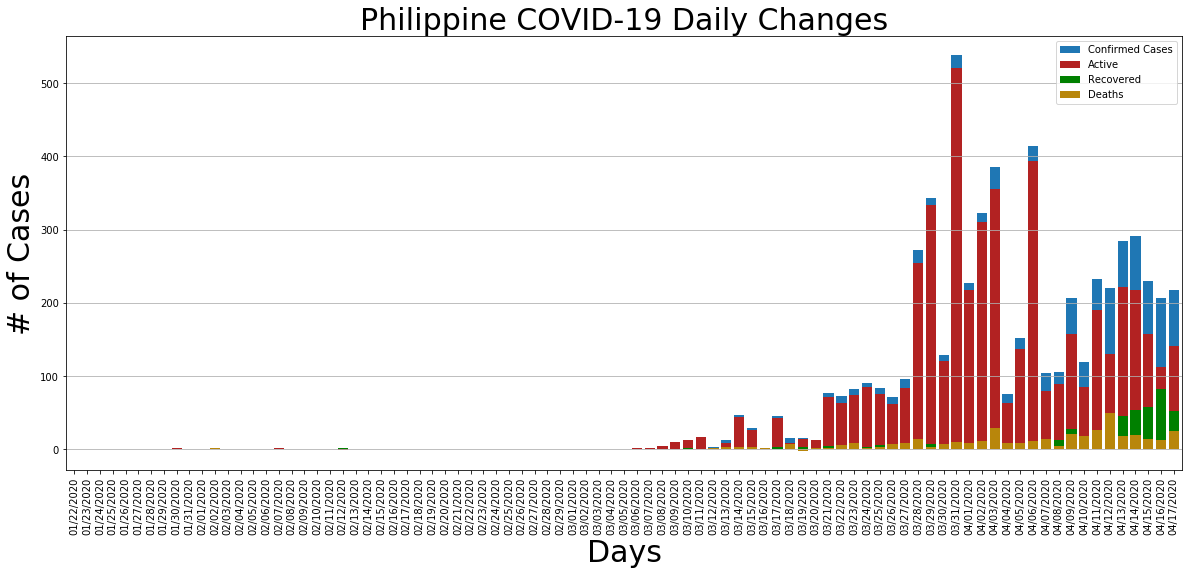
ph_daily_change.Confirmed.plot.bar(figsize=(20, 8), linewidth=4, width=0.8, label='Confirmed Cases', legend=True).grid(axis='y')
ph_daily_change.Active.plot.bar(figsize=(20, 8), linewidth=4, width=0.8, color='firebrick', label='Active', legend=True).grid(axis='y')
ph_daily_change.Recovered.plot.bar(figsize=(20, 8), linewidth=4, width=0.8, color='green', label='Recovered', legend=True).grid(axis='y')
ph_daily_change.Deaths.plot.bar(figsize=(20, 8), linewidth=4, width=0.8, color='darkgoldenrod', label='Deaths', legend=True).grid(axis='y')
plt.title('Philippine COVID-19 Daily Changes', size=30)
plt.xlabel('Days', size=30)
plt.ylabel('# of Cases', size=30);
plt.figure(figsize=(16, 9))
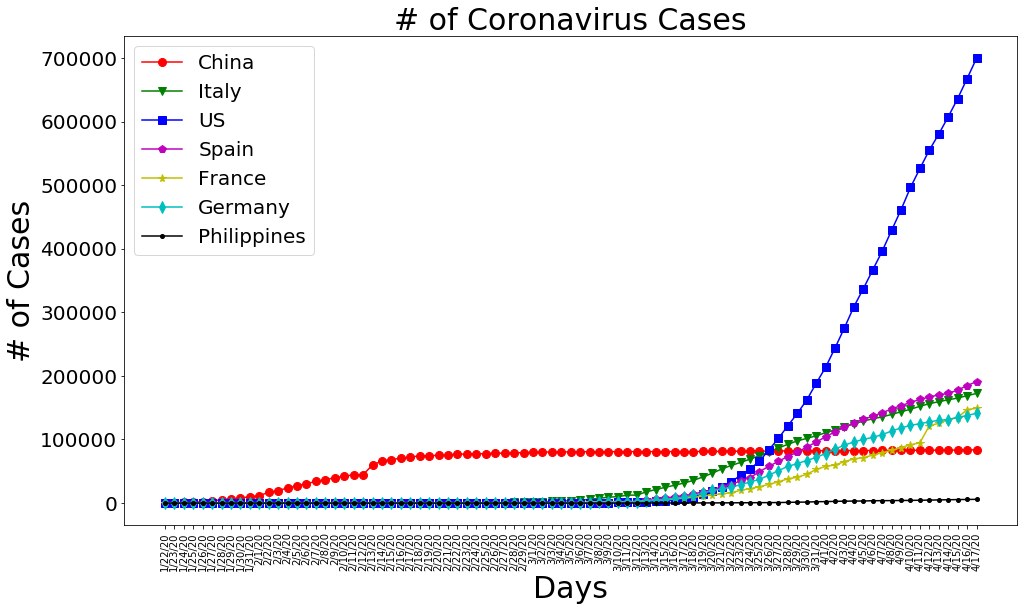
plt.plot(dates, china_cases, 'ro-', markersize=8)
plt.plot(dates, italy_cases, 'gv-', markersize=8)
plt.plot(dates, us_cases, 'bs-', markersize=8)
plt.plot(dates, spain_cases, 'mp-', markersize=8)
plt.plot(dates, france_cases, 'y*-', markersize=8)
plt.plot(dates, germany_cases, 'cd-', markersize=8)
plt.plot(dates, philippine_cases, 'k.-', markersize=8)
plt.title('# of Coronavirus Cases', size=30)
plt.xlabel('Days', size=30)
plt.ylabel('# of Cases', size=30)
plt.legend(['China', 'Italy', 'US', 'Spain', 'France', 'Germany','Philippines'], prop={'size': 20})
plt.xticks(rotation=90)
plt.yticks(size=20)
plt.show()

plt.figure(figsize=(16, 9))
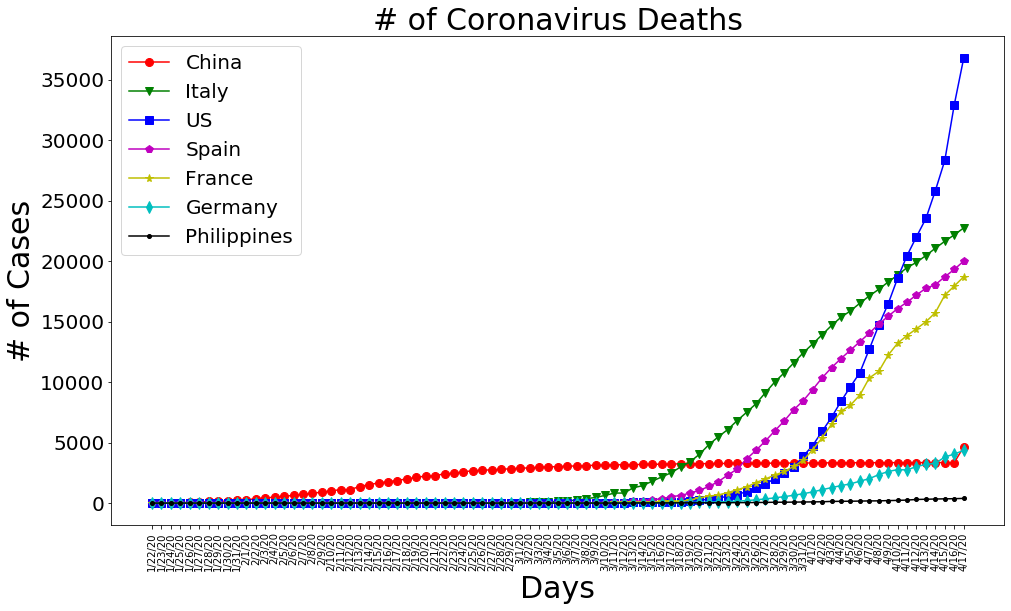
plt.plot(dates, china_deaths, 'ro-', markersize=8)
plt.plot(dates, italy_deaths, 'gv-', markersize=8)
plt.plot(dates, us_deaths, 'bs-', markersize=8)
plt.plot(dates, spain_deaths, 'mp-', markersize=8)
plt.plot(dates, france_deaths, 'y*-', markersize=8)
plt.plot(dates, germany_deaths, 'cd-', markersize=8)
plt.plot(dates, philippine_deaths, 'k.-', markersize=8)
plt.title('# of Coronavirus Deaths', size=30)
plt.xlabel('Days', size=30)
plt.ylabel('# of Cases', size=30)
plt.legend(['China', 'Italy', 'US', 'Spain', 'France', 'Germany','Philippines'], prop={'size': 20})
plt.xticks(rotation=90)
plt.yticks(size=20)
plt.show()

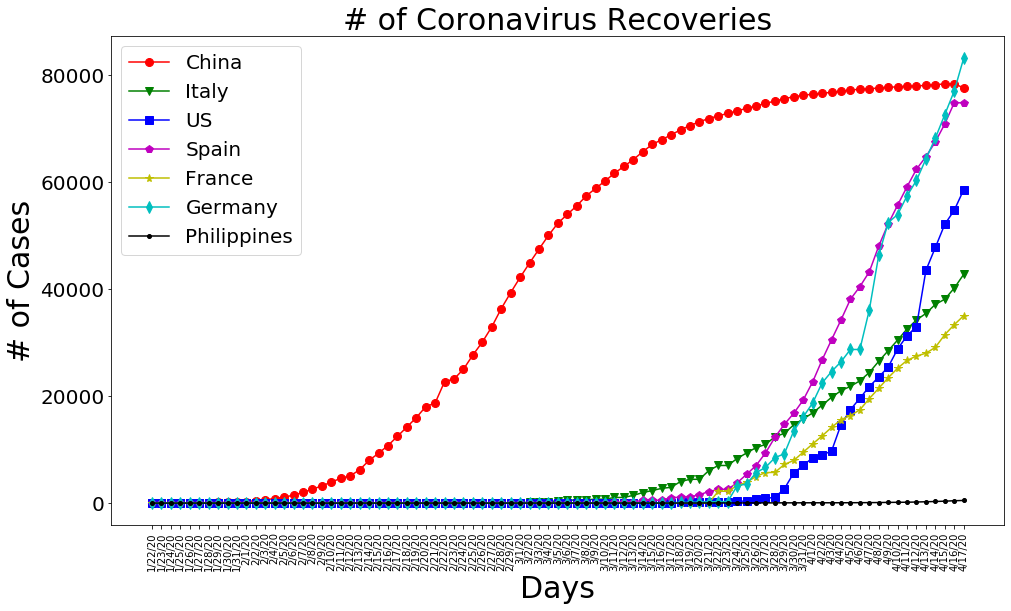
plt.figure(figsize=(16, 9))
plt.plot(dates, china_recoveries, 'ro-', markersize=8)
plt.plot(dates, italy_recoveries, 'gv-', markersize=8)
plt.plot(dates, us_recoveries, 'bs-', markersize=8)
plt.plot(dates, spain_recoveries, 'mp-', markersize=8)
plt.plot(dates, france_recoveries, 'y*-', markersize=8)
plt.plot(dates, germany_recoveries, 'cd-', markersize=8)
plt.plot(dates, philippine_recoveries, 'k.-', markersize=8)
plt.title('# of Coronavirus Recoveries', size=30)
plt.xlabel('Days', size=30)
plt.ylabel('# of Cases', size=30)
plt.legend(['China', 'Italy', 'US', 'Spain', 'France', 'Germany','Philippines'], prop={'size': 20})
plt.xticks(rotation=90)
plt.yticks(size=20)
plt.show()
fig, axs = plt.subplots(6,1, figsize=(15, 64), facecolor='w', edgecolor='k')
fig.subplots_adjust(hspace = .5)
axs = axs.ravel()

ASEAN = ['Indonesia', 'Malaysia', 'Philippines', 'Singapore', 'Thailand', 'Brunei', 'Laos', 'Myanmar', 'Cambodia', 'Vietnam']

for country in ASEAN:
    cases, deaths, recoveries, daily_increase, daily_death, daily_recovery = get_data(country)

    axs[0].plot(dates, cases, markersize=8, linewidth=4)
    axs[0].set_title('# of Coronavirus Cases', size=30)
    axs[0].set_xlabel('Days', size=30)
    axs[0].set_ylabel('# of Cases', size=30)
    axs[0].legend(ASEAN, prop={'size': 20}, loc="upper left")
    axs[0].set_xticklabels(dates, rotation=90)


    axs[1].plot(dates, deaths, markersize=8, linewidth=4)
    axs[1].set_title('# of Coronavirus Deaths', size=30)
    axs[1].set_xlabel('Days', size=30)
    axs[1].set_ylabel('# of Cases', size=30)
    axs[1].legend(ASEAN, prop={'size': 20}, loc="upper left")
    axs[1].set_xticklabels(dates, rotation=90)


    axs[2].plot(dates, recoveries, markersize=8, linewidth=4)
    axs[2].set_title('# of Coronavirus Recoveries', size=30)
    axs[2].set_xlabel('Days', size=30)
    axs[2].set_ylabel('# of Cases', size=30)
    axs[2].legend(ASEAN, prop={'size': 20}, loc="upper left")
    axs[2].set_xticklabels(dates, rotation=90)


    axs[3].plot(dates, daily_increase, markersize=8, linewidth=4)
    axs[3].set_title('# of Coronavirus Daily Increase', size=30)
    axs[3].set_xlabel('Days', size=30)
    axs[3].set_ylabel('# of Cases', size=30)
    axs[3].legend(ASEAN, prop={'size': 20}, loc="upper left")
    axs[3].set_xticklabels(dates, rotation=90)


    axs[4].plot(dates, daily_death, markersize=8, linewidth=4)
    axs[4].set_title('# of Coronavirus Daily Deaths', size=30)
    axs[4].set_xlabel('Days', size=30)
    axs[4].set_ylabel('# of Cases', size=30)
    axs[4].legend(ASEAN, prop={'size': 20}, loc="upper left")
    axs[4].set_xticklabels(dates, rotation=90)


    axs[5].plot(dates, daily_recovery, markersize=8, linewidth=4)
    axs[5].set_title('# of Coronavirus Recoveries Daily Increase', size=30)
    axs[5].set_xlabel('Days', size=30)
    axs[5].set_ylabel('# of Cases', size=30)
    axs[5].legend(ASEAN, prop={'size': 20}, loc="upper left")
    axs[5].set_xticklabels(dates, rotation=90)

Mortality
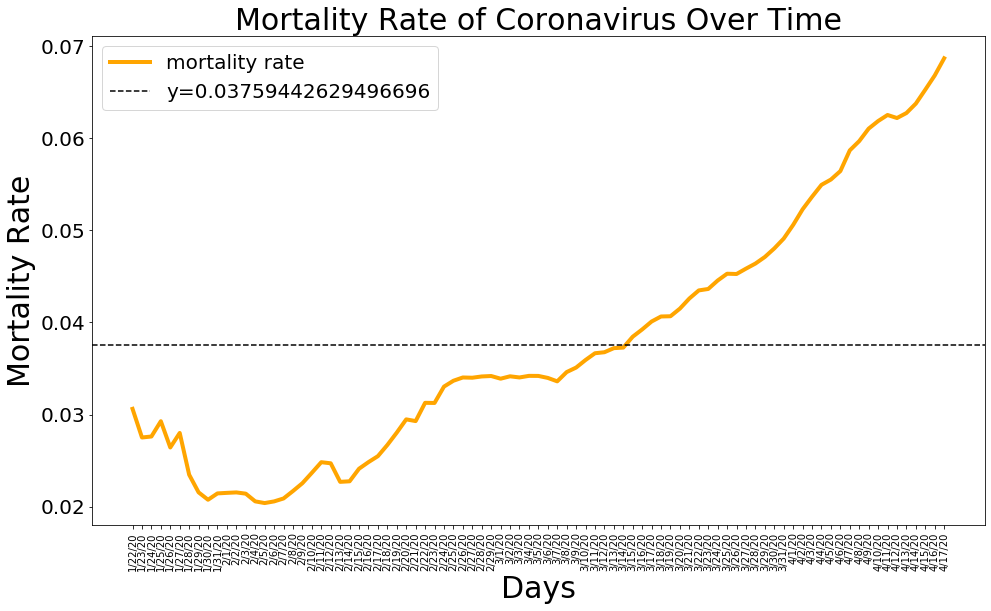
mean_mortality_rate = np.mean(mortality_rate)
plt.figure(figsize=(16, 9))
plt.plot(dates, mortality_rate, color='orange', linewidth=4)
plt.axhline(y = mean_mortality_rate,linestyle='--', color='black')
plt.title('Mortality Rate of Coronavirus Over Time', size=30)
plt.legend(['mortality rate', 'y='+str(mean_mortality_rate)], prop={'size': 20})
plt.xlabel('Days', size=30)
plt.ylabel('Mortality Rate', size=30)
plt.xticks(rotation=90)
plt.yticks(size=20)
plt.show()
Recovery Rate
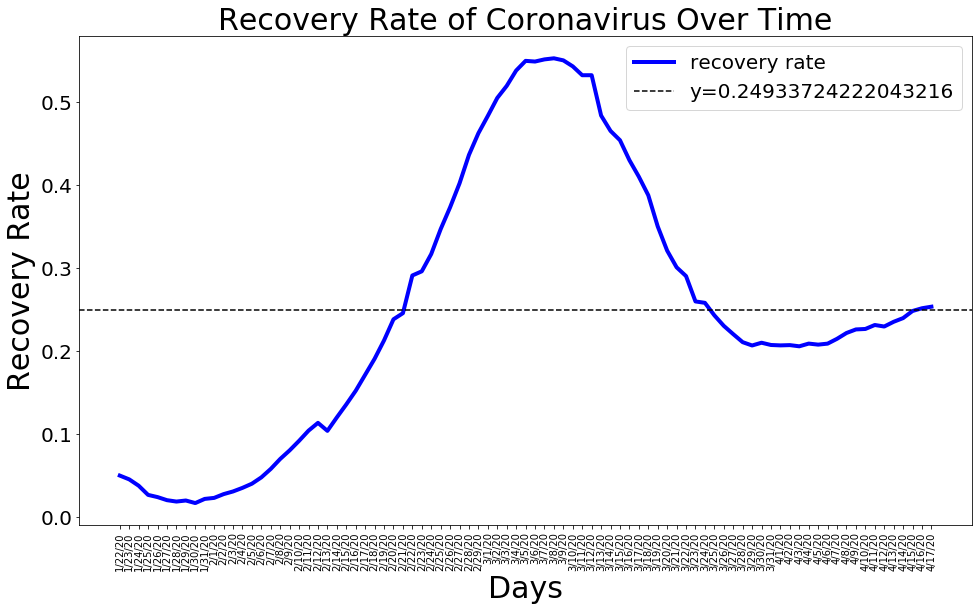
mean_recovery_rate = np.mean(recovery_rate)
plt.figure(figsize=(16, 9))
plt.plot(dates, recovery_rate, color='blue', linewidth=4)
plt.axhline(y = mean_recovery_rate,linestyle='--', color='black')
plt.title('Recovery Rate of Coronavirus Over Time', size=30)
plt.legend(['recovery rate', 'y='+str(mean_recovery_rate)], prop={'size': 20})
plt.xlabel('Days', size=30)
plt.ylabel('Recovery Rate', size=30)
plt.xticks(rotation=90)
plt.yticks(size=20)
plt.show()
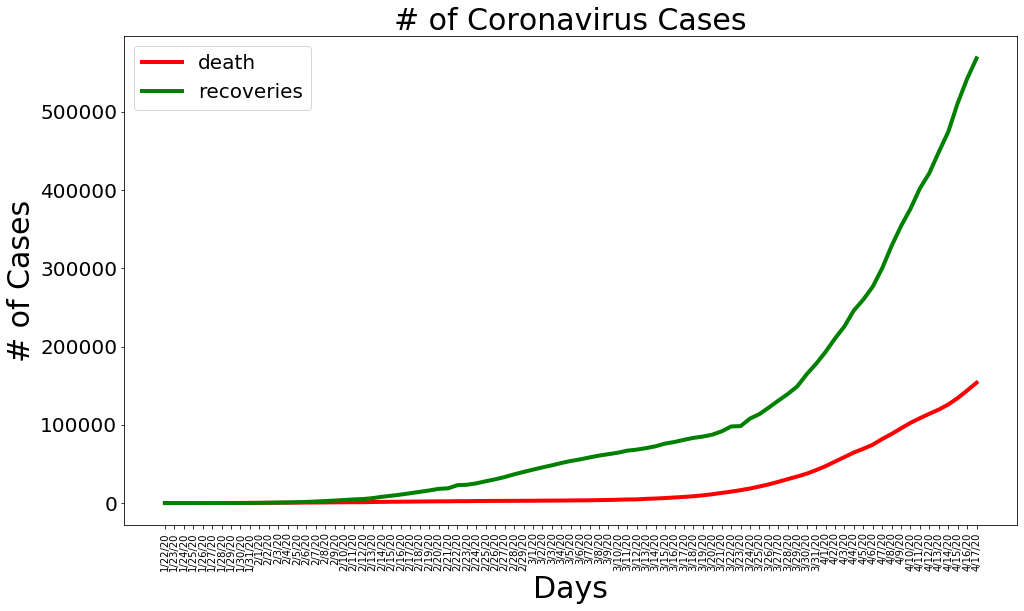
plt.figure(figsize=(16, 9))
plt.plot(dates, total_deaths, color='red', linewidth=4)
plt.plot(dates, total_recovered, color='green', linewidth=4)
plt.legend(['death', 'recoveries'], loc='best', fontsize=20)
plt.title('# of Coronavirus Cases', size=30)
plt.xlabel('Days', size=30)
plt.ylabel('# of Cases', size=30)
plt.xticks(rotation=90)
plt.yticks(size=20)
plt.show()
COVID-19 By Country
import operator

unique_countries =  list(latest_data['Country_Region'].unique())

country_confirmed_cases = []
country_death_cases = []
country_active_cases = []
country_recovery_cases = []
country_mortality_rate = []

no_cases = []
for i in unique_countries:
    cases = latest_data[latest_data['Country_Region']==i]['Confirmed'].sum()
    if cases > 0:
        country_confirmed_cases.append(cases)
    else:
        no_cases.append(i)

for i in no_cases:
    unique_countries.remove(i)

# sort countries by the number of confirmed cases
unique_countries = [k for k, v in sorted(zip(unique_countries, country_confirmed_cases), key=operator.itemgetter(1), reverse=True)]
for i in range(len(unique_countries)):
    country_confirmed_cases[i] = latest_data[latest_data['Country_Region']==unique_countries[i]]['Confirmed'].sum()
    country_death_cases.append(latest_data[latest_data['Country_Region']==unique_countries[i]]['Deaths'].sum())
    country_recovery_cases.append(latest_data[latest_data['Country_Region']==unique_countries[i]]['Recovered'].sum())
    country_active_cases.append(country_confirmed_cases[i] - country_death_cases[i] - country_recovery_cases[i])
    country_mortality_rate.append(country_death_cases[i]/country_confirmed_cases[i])
country_df = pd.DataFrame({'Country Name': unique_countries, 'Number of Confirmed Cases': country_confirmed_cases,
                          'Number of Deaths': country_death_cases, 'Number of Recoveries' : country_recovery_cases,
                          'Number of Active Cases' : country_active_cases,
                          'Mortality Rate': country_mortality_rate})
# number of cases per country/region

country_df.style.background_gradient(cmap='Greens')
| Country Name | Number of Confirmed Cases | Number of Deaths | Number of Recoveries | Number of Active Cases | Mortality Rate | |
|---|---|---|---|---|---|---|
| 0 | US | 667801 | 32916 | 54703 | 580182 | 0.049290 |
| 1 | Spain | 184948 | 19315 | 74797 | 90836 | 0.104435 |
| 2 | Italy | 168941 | 22170 | 40164 | 106607 | 0.131229 |
| 3 | France | 147091 | 17941 | 33327 | 95823 | 0.121972 |
| 4 | Germany | 137698 | 4052 | 77000 | 56646 | 0.029427 |
| 5 | United Kingdom | 104145 | 13759 | 375 | 90011 | 0.132114 |
| 6 | China | 83403 | 3346 | 78401 | 1656 | 0.040118 |
| 7 | Iran | 77995 | 4869 | 52229 | 20897 | 0.062427 |
| 8 | Turkey | 74193 | 1643 | 7089 | 65461 | 0.022145 |
| 9 | Belgium | 34809 | 4857 | 7562 | 22390 | 0.139533 |
| 10 | Canada | 30809 | 1258 | 9698 | 19853 | 0.040832 |
| 11 | Brazil | 30425 | 1924 | 14026 | 14475 | 0.063237 |
| 12 | Netherlands | 29383 | 3327 | 311 | 25745 | 0.113229 |
| 13 | Russia | 27938 | 232 | 2304 | 25402 | 0.008304 |
| 14 | Switzerland | 26732 | 1281 | 15900 | 9551 | 0.047920 |
| 15 | Portugal | 18841 | 629 | 493 | 17719 | 0.033385 |
| 16 | Austria | 14476 | 410 | 8986 | 5080 | 0.028323 |
| 17 | India | 13430 | 448 | 1768 | 11214 | 0.033358 |
| 18 | Ireland | 13271 | 486 | 77 | 12708 | 0.036621 |
| 19 | Israel | 12758 | 142 | 2818 | 9798 | 0.011130 |
| 20 | Sweden | 12540 | 1333 | 550 | 10657 | 0.106300 |
| 21 | Peru | 12491 | 274 | 6120 | 6097 | 0.021936 |
| 22 | Korea, South | 10613 | 229 | 7757 | 2627 | 0.021577 |
| 23 | Chile | 8807 | 105 | 3299 | 5403 | 0.011922 |
| 24 | Japan | 8626 | 178 | 901 | 7547 | 0.020635 |
| 25 | Ecuador | 8225 | 403 | 838 | 6984 | 0.048997 |
| 26 | Poland | 7918 | 314 | 774 | 6830 | 0.039656 |
| 27 | Romania | 7707 | 392 | 1357 | 5958 | 0.050863 |
| 28 | Denmark | 7074 | 321 | 3203 | 3550 | 0.045377 |
| 29 | Pakistan | 6919 | 128 | 1645 | 5146 | 0.018500 |
| 30 | Norway | 6896 | 152 | 32 | 6712 | 0.022042 |
| 31 | Australia | 6462 | 63 | 2355 | 4044 | 0.009749 |
| 32 | Czechia | 6433 | 169 | 972 | 5292 | 0.026271 |
| 33 | Saudi Arabia | 6380 | 83 | 990 | 5307 | 0.013009 |
| 34 | Mexico | 5847 | 449 | 2125 | 3273 | 0.076792 |
| 35 | United Arab Emirates | 5825 | 35 | 1095 | 4695 | 0.006009 |
| 36 | Philippines | 5660 | 362 | 435 | 4863 | 0.063958 |
| 37 | Indonesia | 5516 | 496 | 548 | 4472 | 0.089920 |
| 38 | Serbia | 5318 | 103 | 0 | 5215 | 0.019368 |
| 39 | Malaysia | 5182 | 84 | 2766 | 2332 | 0.016210 |
| 40 | Singapore | 4427 | 10 | 683 | 3734 | 0.002259 |
| 41 | Belarus | 4204 | 40 | 203 | 3961 | 0.009515 |
| 42 | Ukraine | 4161 | 116 | 186 | 3859 | 0.027878 |
| 43 | Qatar | 4103 | 7 | 415 | 3681 | 0.001706 |
| 44 | Dominican Republic | 3755 | 196 | 215 | 3344 | 0.052197 |
| 45 | Panama | 3751 | 103 | 75 | 3573 | 0.027459 |
| 46 | Luxembourg | 3444 | 69 | 552 | 2823 | 0.020035 |
| 47 | Finland | 3369 | 75 | 1700 | 1594 | 0.022262 |
| 48 | Colombia | 3233 | 144 | 550 | 2539 | 0.044541 |
| 49 | Egypt | 2673 | 196 | 596 | 1881 | 0.073326 |
| 50 | Thailand | 2672 | 46 | 1593 | 1033 | 0.017216 |
| 51 | South Africa | 2605 | 48 | 903 | 1654 | 0.018426 |
| 52 | Argentina | 2571 | 115 | 631 | 1825 | 0.044730 |
| 53 | Morocco | 2283 | 130 | 249 | 1904 | 0.056943 |
| 54 | Algeria | 2268 | 348 | 783 | 1137 | 0.153439 |
| 55 | Greece | 2207 | 105 | 269 | 1833 | 0.047576 |
| 56 | Moldova | 2154 | 54 | 235 | 1865 | 0.025070 |
| 57 | Croatia | 1791 | 35 | 529 | 1227 | 0.019542 |
| 58 | Iceland | 1739 | 8 | 1144 | 587 | 0.004600 |
| 59 | Bahrain | 1700 | 7 | 703 | 990 | 0.004118 |
| 60 | Hungary | 1652 | 142 | 199 | 1311 | 0.085956 |
| 61 | Bangladesh | 1572 | 60 | 49 | 1463 | 0.038168 |
| 62 | Kuwait | 1524 | 3 | 225 | 1296 | 0.001969 |
| 63 | Estonia | 1434 | 36 | 133 | 1265 | 0.025105 |
| 64 | Iraq | 1434 | 80 | 856 | 498 | 0.055788 |
| 65 | Kazakhstan | 1402 | 17 | 277 | 1108 | 0.012126 |
| 66 | New Zealand | 1401 | 9 | 770 | 622 | 0.006424 |
| 67 | Uzbekistan | 1349 | 4 | 129 | 1216 | 0.002965 |
| 68 | Azerbaijan | 1283 | 15 | 460 | 808 | 0.011691 |
| 69 | Slovenia | 1268 | 61 | 174 | 1033 | 0.048107 |
| 70 | Bosnia and Herzegovina | 1167 | 43 | 277 | 847 | 0.036847 |
| 71 | Armenia | 1159 | 18 | 358 | 783 | 0.015531 |
| 72 | Lithuania | 1128 | 32 | 178 | 918 | 0.028369 |
| 73 | North Macedonia | 1081 | 46 | 121 | 914 | 0.042553 |
| 74 | Oman | 1019 | 4 | 176 | 839 | 0.003925 |
| 75 | Cameroon | 996 | 22 | 164 | 810 | 0.022088 |
| 76 | Slovakia | 977 | 8 | 167 | 802 | 0.008188 |
| 77 | Cuba | 862 | 27 | 171 | 664 | 0.031323 |
| 78 | Afghanistan | 840 | 30 | 54 | 756 | 0.035714 |
| 79 | Tunisia | 822 | 37 | 43 | 742 | 0.045012 |
| 80 | Bulgaria | 800 | 38 | 122 | 640 | 0.047500 |
| 81 | Cyprus | 735 | 12 | 77 | 646 | 0.016327 |
| 82 | Diamond Princess | 712 | 12 | 644 | 56 | 0.016854 |
| 83 | Latvia | 675 | 5 | 57 | 613 | 0.007407 |
| 84 | Andorra | 673 | 33 | 169 | 471 | 0.049034 |
| 85 | Lebanon | 663 | 21 | 86 | 556 | 0.031674 |
| 86 | Cote d'Ivoire | 654 | 6 | 146 | 502 | 0.009174 |
| 87 | Costa Rica | 642 | 4 | 74 | 564 | 0.006231 |
| 88 | Ghana | 641 | 8 | 83 | 550 | 0.012480 |
| 89 | Djibouti | 591 | 2 | 73 | 516 | 0.003384 |
| 90 | Niger | 584 | 14 | 90 | 480 | 0.023973 |
| 91 | Burkina Faso | 546 | 32 | 257 | 257 | 0.058608 |
| 92 | Albania | 518 | 26 | 277 | 215 | 0.050193 |
| 93 | Uruguay | 502 | 9 | 286 | 207 | 0.017928 |
| 94 | Kyrgyzstan | 466 | 5 | 91 | 370 | 0.010730 |
| 95 | Kosovo | 449 | 11 | 79 | 359 | 0.024499 |
| 96 | Nigeria | 442 | 13 | 152 | 277 | 0.029412 |
| 97 | Bolivia | 441 | 29 | 14 | 398 | 0.065760 |
| 98 | Guinea | 438 | 1 | 49 | 388 | 0.002283 |
| 99 | Honduras | 426 | 35 | 9 | 382 | 0.082160 |
| 100 | San Marino | 426 | 38 | 55 | 333 | 0.089202 |
| 101 | Malta | 412 | 3 | 82 | 327 | 0.007282 |
| 102 | Jordan | 402 | 7 | 259 | 136 | 0.017413 |
| 103 | Taiwan* | 395 | 6 | 155 | 234 | 0.015190 |
| 104 | West Bank and Gaza | 374 | 2 | 63 | 309 | 0.005348 |
| 105 | Georgia | 348 | 3 | 76 | 269 | 0.008621 |
| 106 | Senegal | 335 | 2 | 194 | 139 | 0.005970 |
| 107 | Mauritius | 324 | 9 | 81 | 234 | 0.027778 |
| 108 | Montenegro | 303 | 4 | 55 | 244 | 0.013201 |
| 109 | Vietnam | 268 | 0 | 177 | 91 | 0.000000 |
| 110 | Congo (Kinshasa) | 267 | 22 | 23 | 222 | 0.082397 |
| 111 | Sri Lanka | 238 | 7 | 68 | 163 | 0.029412 |
| 112 | Kenya | 234 | 11 | 53 | 170 | 0.047009 |
| 113 | Venezuela | 204 | 9 | 111 | 84 | 0.044118 |
| 114 | Guatemala | 196 | 5 | 19 | 172 | 0.025510 |
| 115 | Paraguay | 174 | 8 | 30 | 136 | 0.045977 |
| 116 | Mali | 171 | 13 | 34 | 124 | 0.076023 |
| 117 | El Salvador | 164 | 6 | 33 | 125 | 0.036585 |
| 118 | Jamaica | 143 | 5 | 21 | 117 | 0.034965 |
| 119 | Rwanda | 138 | 0 | 60 | 78 | 0.000000 |
| 120 | Brunei | 136 | 1 | 108 | 27 | 0.007353 |
| 121 | Cambodia | 122 | 0 | 98 | 24 | 0.000000 |
| 122 | Congo (Brazzaville) | 117 | 5 | 11 | 101 | 0.042735 |
| 123 | Trinidad and Tobago | 114 | 8 | 20 | 86 | 0.070175 |
| 124 | Madagascar | 111 | 0 | 33 | 78 | 0.000000 |
| 125 | Tanzania | 94 | 4 | 11 | 79 | 0.042553 |
| 126 | Monaco | 93 | 3 | 12 | 78 | 0.032258 |
| 127 | Ethiopia | 92 | 3 | 15 | 74 | 0.032609 |
| 128 | Burma | 85 | 4 | 2 | 79 | 0.047059 |
| 129 | Togo | 81 | 5 | 45 | 31 | 0.061728 |
| 130 | Gabon | 80 | 1 | 4 | 75 | 0.012500 |
| 131 | Somalia | 80 | 5 | 2 | 73 | 0.062500 |
| 132 | Liechtenstein | 79 | 1 | 55 | 23 | 0.012658 |
| 133 | Barbados | 75 | 5 | 15 | 55 | 0.066667 |
| 134 | Liberia | 59 | 6 | 4 | 49 | 0.101695 |
| 135 | Cabo Verde | 56 | 1 | 1 | 54 | 0.017857 |
| 136 | Guyana | 55 | 6 | 8 | 41 | 0.109091 |
| 137 | Uganda | 55 | 0 | 20 | 35 | 0.000000 |
| 138 | Bahamas | 53 | 8 | 6 | 39 | 0.150943 |
| 139 | Equatorial Guinea | 51 | 0 | 4 | 47 | 0.000000 |
| 140 | Libya | 49 | 1 | 11 | 37 | 0.020408 |
| 141 | Zambia | 48 | 2 | 30 | 16 | 0.041667 |
| 142 | Guinea-Bissau | 43 | 0 | 0 | 43 | 0.000000 |
| 143 | Haiti | 41 | 3 | 0 | 38 | 0.073171 |
| 144 | Benin | 35 | 1 | 18 | 16 | 0.028571 |
| 145 | Eritrea | 35 | 0 | 0 | 35 | 0.000000 |
| 146 | Syria | 33 | 2 | 5 | 26 | 0.060606 |
| 147 | Sudan | 32 | 5 | 4 | 23 | 0.156250 |
| 148 | Mongolia | 31 | 0 | 5 | 26 | 0.000000 |
| 149 | Mozambique | 31 | 0 | 2 | 29 | 0.000000 |
| 150 | Chad | 27 | 0 | 5 | 22 | 0.000000 |
| 151 | Maldives | 25 | 0 | 16 | 9 | 0.000000 |
| 152 | Antigua and Barbuda | 23 | 3 | 3 | 17 | 0.130435 |
| 153 | Zimbabwe | 23 | 3 | 1 | 19 | 0.130435 |
| 154 | Angola | 19 | 2 | 5 | 12 | 0.105263 |
| 155 | Laos | 19 | 0 | 2 | 17 | 0.000000 |
| 156 | Belize | 18 | 2 | 0 | 16 | 0.111111 |
| 157 | Timor-Leste | 18 | 0 | 1 | 17 | 0.000000 |
| 158 | Fiji | 17 | 0 | 0 | 17 | 0.000000 |
| 159 | Dominica | 16 | 0 | 8 | 8 | 0.000000 |
| 160 | Eswatini | 16 | 1 | 8 | 7 | 0.062500 |
| 161 | Malawi | 16 | 2 | 0 | 14 | 0.125000 |
| 162 | Namibia | 16 | 0 | 4 | 12 | 0.000000 |
| 163 | Nepal | 16 | 0 | 2 | 14 | 0.000000 |
| 164 | Botswana | 15 | 1 | 0 | 14 | 0.066667 |
| 165 | Saint Lucia | 15 | 0 | 11 | 4 | 0.000000 |
| 166 | Sierra Leone | 15 | 0 | 0 | 15 | 0.000000 |
| 167 | Grenada | 14 | 0 | 0 | 14 | 0.000000 |
| 168 | Saint Kitts and Nevis | 14 | 0 | 0 | 14 | 0.000000 |
| 169 | Central African Republic | 12 | 0 | 4 | 8 | 0.000000 |
| 170 | Saint Vincent and the Grenadines | 12 | 0 | 1 | 11 | 0.000000 |
| 171 | Seychelles | 11 | 0 | 0 | 11 | 0.000000 |
| 172 | Suriname | 10 | 1 | 6 | 3 | 0.100000 |
| 173 | Gambia | 9 | 1 | 2 | 6 | 0.111111 |
| 174 | MS Zaandam | 9 | 2 | 0 | 7 | 0.222222 |
| 175 | Nicaragua | 9 | 1 | 4 | 4 | 0.111111 |
| 176 | Holy See | 8 | 0 | 2 | 6 | 0.000000 |
| 177 | Mauritania | 7 | 1 | 2 | 4 | 0.142857 |
| 178 | Papua New Guinea | 7 | 0 | 0 | 7 | 0.000000 |
| 179 | Western Sahara | 6 | 0 | 0 | 6 | 0.000000 |
| 180 | Bhutan | 5 | 0 | 2 | 3 | 0.000000 |
| 181 | Burundi | 5 | 1 | 0 | 4 | 0.200000 |
| 182 | Sao Tome and Principe | 4 | 0 | 0 | 4 | 0.000000 |
| 183 | South Sudan | 4 | 0 | 0 | 4 | 0.000000 |
| 184 | Yemen | 1 | 0 | 0 | 1 | 0.000000 |
COVID-19 By Provinces/State/City
unique_provinces =  list(latest_data['Province_State'].unique())

province_confirmed_cases = []
province_country = []
province_death_cases = []
province_recovery_cases = []
province_mortality_rate = []

no_cases = []
for i in unique_provinces:
    cases = latest_data[latest_data['Province_State']==i]['Confirmed'].sum()
    if cases > 0:
        province_confirmed_cases.append(cases)
    else:
        no_cases.append(i)

# remove areas with no confirmed cases
for i in no_cases:
    unique_provinces.remove(i)

unique_provinces = [k for k, v in sorted(zip(unique_provinces, province_confirmed_cases), key=operator.itemgetter(1), reverse=True)]
for i in range(len(unique_provinces)):
    province_confirmed_cases[i] = latest_data[latest_data['Province_State']==unique_provinces[i]]['Confirmed'].sum()
    province_country.append(latest_data[latest_data['Province_State']==unique_provinces[i]]['Country_Region'].unique()[0])
    province_death_cases.append(latest_data[latest_data['Province_State']==unique_provinces[i]]['Deaths'].sum())
    province_recovery_cases.append(latest_data[latest_data['Province_State']==unique_provinces[i]]['Recovered'].sum())
    province_mortality_rate.append(province_death_cases[i]/province_confirmed_cases[i])
# number of cases per province/state/city
province_df = pd.DataFrame({'Province/State Name': unique_provinces, 'Country': province_country, 'Number of Confirmed Cases': province_confirmed_cases,
                          'Number of Deaths': province_death_cases, 'Number of Recoveries' : province_recovery_cases,
                          'Mortality Rate': province_mortality_rate})
# number of cases per country/region

province_df.style.background_gradient(cmap='Greens')
| Province/State Name | Country | Number of Confirmed Cases | Number of Deaths | Number of Recoveries | Mortality Rate | |
|---|---|---|---|---|---|---|
| 0 | New York | US | 223691 | 14832 | 0 | 0.066306 |
| 1 | New Jersey | US | 75317 | 3518 | 0 | 0.046709 |
| 2 | Hubei | China | 67803 | 3222 | 64435 | 0.047520 |
| 3 | Massachusetts | US | 32181 | 1108 | 0 | 0.034430 |
| 4 | Michigan | US | 28809 | 1996 | 0 | 0.069284 |
| 5 | Pennsylvania | US | 28258 | 841 | 0 | 0.029761 |
| 6 | California | US | 27677 | 956 | 0 | 0.034541 |
| 7 | Illinois | US | 25734 | 1072 | 0 | 0.041657 |
| 8 | Florida | US | 23343 | 668 | 0 | 0.028617 |
| 9 | Louisiana | US | 22532 | 1156 | 0 | 0.051305 |
| 10 | Texas | US | 16876 | 414 | 0 | 0.024532 |
| 11 | Connecticut | US | 15884 | 971 | 0 | 0.061131 |
| 12 | Quebec | Canada | 15857 | 630 | 0 | 0.039730 |
| 13 | Georgia | US | 15669 | 587 | 0 | 0.037463 |
| 14 | Washington | US | 11057 | 579 | 0 | 0.052365 |
| 15 | Maryland | US | 10784 | 319 | 0 | 0.029581 |
| 16 | Ontario | Canada | 9840 | 490 | 0 | 0.049797 |
| 17 | Indiana | US | 9542 | 477 | 0 | 0.049990 |
| 18 | Ohio | US | 8414 | 407 | 0 | 0.048372 |
| 19 | Colorado | US | 8286 | 355 | 0 | 0.042843 |
| 20 | Virginia | US | 6889 | 208 | 0 | 0.030193 |
| 21 | Tennessee | US | 6375 | 136 | 0 | 0.021333 |
| 22 | North Carolina | US | 5639 | 150 | 0 | 0.026600 |
| 23 | Missouri | US | 5174 | 169 | 0 | 0.032663 |
| 24 | Alabama | US | 4345 | 133 | 0 | 0.030610 |
| 25 | Arizona | US | 4237 | 150 | 0 | 0.035402 |
| 26 | South Carolina | US | 3931 | 111 | 0 | 0.028237 |
| 27 | Wisconsin | US | 3875 | 197 | 0 | 0.050839 |
| 28 | Mississippi | US | 3624 | 129 | 0 | 0.035596 |
| 29 | Rhode Island | US | 3529 | 87 | 0 | 0.024653 |
| 30 | Nevada | US | 3214 | 137 | 0 | 0.042626 |
| 31 | New South Wales | Australia | 2897 | 25 | 4 | 0.008630 |
| 32 | Utah | US | 2683 | 20 | 0 | 0.007454 |
| 33 | Kentucky | US | 2435 | 129 | 0 | 0.052977 |
| 34 | Oklahoma | US | 2357 | 131 | 0 | 0.055579 |
| 35 | District of Columbia | US | 2350 | 81 | 0 | 0.034468 |
| 36 | Iowa | US | 2141 | 60 | 0 | 0.028024 |
| 37 | Delaware | US | 2070 | 55 | 0 | 0.026570 |
| 38 | Alberta | Canada | 1996 | 48 | 0 | 0.024048 |
| 39 | Minnesota | US | 1809 | 87 | 0 | 0.048093 |
| 40 | Oregon | US | 1736 | 64 | 0 | 0.036866 |
| 41 | Arkansas | US | 1620 | 37 | 0 | 0.022840 |
| 42 | Kansas | US | 1615 | 80 | 0 | 0.049536 |
| 43 | Idaho | US | 1587 | 41 | 0 | 0.025835 |
| 44 | Guangdong | China | 1571 | 8 | 1471 | 0.005092 |
| 45 | British Columbia | Canada | 1561 | 75 | 0 | 0.048046 |
| 46 | New Mexico | US | 1484 | 36 | 0 | 0.024259 |
| 47 | South Dakota | US | 1311 | 7 | 0 | 0.005339 |
| 48 | Victoria | Australia | 1299 | 14 | 1137 | 0.010778 |
| 49 | Henan | China | 1276 | 22 | 1254 | 0.017241 |
| 50 | Zhejiang | China | 1268 | 1 | 1244 | 0.000789 |
| 51 | New Hampshire | US | 1139 | 32 | 0 | 0.028095 |
| 52 | Puerto Rico | US | 1043 | 56 | 0 | 0.053691 |
| 53 | Hunan | China | 1019 | 4 | 1014 | 0.003925 |
| 54 | Hong Kong | China | 1017 | 4 | 485 | 0.003933 |
| 55 | Queensland | Australia | 1001 | 5 | 442 | 0.004995 |
| 56 | Anhui | China | 991 | 6 | 984 | 0.006054 |
| 57 | Nebraska | US | 952 | 21 | 0 | 0.022059 |
| 58 | Jiangxi | China | 937 | 1 | 936 | 0.001067 |
| 59 | Heilongjiang | China | 861 | 13 | 471 | 0.015099 |
| 60 | Maine | US | 796 | 27 | 0 | 0.033920 |
| 61 | Shandong | China | 784 | 7 | 761 | 0.008929 |
| 62 | Vermont | US | 774 | 33 | 0 | 0.042636 |
| 63 | West Virginia | US | 728 | 12 | 0 | 0.016484 |
| 64 | Jiangsu | China | 653 | 0 | 642 | 0.000000 |
| 65 | Shanghai | China | 628 | 7 | 489 | 0.011146 |
| 66 | Beijing | China | 593 | 8 | 503 | 0.013491 |
| 67 | Chongqing | China | 579 | 6 | 570 | 0.010363 |
| 68 | Nova Scotia | Canada | 579 | 3 | 0 | 0.005181 |
| 69 | Sichuan | China | 560 | 3 | 552 | 0.005357 |
| 70 | Western Australia | Australia | 532 | 6 | 338 | 0.011278 |
| 71 | Hawaii | US | 530 | 9 | 0 | 0.016981 |
| 72 | Channel Islands | United Kingdom | 457 | 19 | 73 | 0.041575 |
| 73 | South Australia | Australia | 433 | 4 | 279 | 0.009238 |
| 74 | Montana | US | 415 | 7 | 0 | 0.016867 |
| 75 | Reunion | France | 394 | 0 | 237 | 0.000000 |
| 76 | North Dakota | US | 393 | 9 | 0 | 0.022901 |
| 77 | Fujian | China | 353 | 1 | 333 | 0.002833 |
| 78 | Hebei | China | 328 | 6 | 315 | 0.018293 |
| 79 | Saskatchewan | Canada | 305 | 4 | 0 | 0.013115 |
| 80 | Alaska | US | 300 | 9 | 0 | 0.030000 |
| 81 | Wyoming | US | 296 | 2 | 0 | 0.006757 |
| 82 | Isle of Man | United Kingdom | 284 | 4 | 154 | 0.014085 |
| 83 | Shaanxi | China | 256 | 3 | 251 | 0.011719 |
| 84 | Guangxi | China | 254 | 2 | 252 | 0.007874 |
| 85 | Newfoundland and Labrador | Canada | 252 | 3 | 0 | 0.011905 |
| 86 | Manitoba | Canada | 250 | 5 | 0 | 0.020000 |
| 87 | Mayotte | France | 233 | 3 | 69 | 0.012876 |
| 88 | Shanxi | China | 194 | 0 | 135 | 0.000000 |
| 89 | Inner Mongolia | China | 193 | 1 | 94 | 0.005181 |
| 90 | Tianjin | China | 186 | 3 | 172 | 0.016129 |
| 91 | Faroe Islands | Denmark | 184 | 0 | 169 | 0.000000 |
| 92 | Yunnan | China | 184 | 2 | 176 | 0.010870 |
| 93 | Tasmania | Australia | 169 | 6 | 67 | 0.035503 |
| 94 | Hainan | China | 168 | 6 | 162 | 0.035714 |
| 95 | Martinique | France | 158 | 8 | 73 | 0.050633 |
| 96 | Guizhou | China | 146 | 2 | 144 | 0.013699 |
| 97 | Guadeloupe | France | 145 | 8 | 67 | 0.055172 |
| 98 | Liaoning | China | 145 | 2 | 140 | 0.013793 |
| 99 | Gansu | China | 139 | 2 | 137 | 0.014388 |
| 100 | Guam | US | 135 | 5 | 0 | 0.037037 |
| 101 | Gibraltar | United Kingdom | 131 | 0 | 104 | 0.000000 |
| 102 | New Brunswick | Canada | 117 | 0 | 0 | 0.000000 |
| 103 | Grand Princess | Canada | 116 | 0 | 0 | 0.000000 |
| 104 | Australian Capital Territory | Australia | 103 | 3 | 82 | 0.029126 |
| 105 | Jilin | China | 102 | 1 | 96 | 0.009804 |
| 106 | Aruba | Netherlands | 95 | 2 | 39 | 0.021053 |
| 107 | French Guiana | France | 86 | 0 | 51 | 0.000000 |
| 108 | Bermuda | United Kingdom | 81 | 5 | 33 | 0.061728 |
| 109 | Xinjiang | China | 76 | 3 | 73 | 0.039474 |
| 110 | Ningxia | China | 75 | 0 | 75 | 0.000000 |
| 111 | Cayman Islands | United Kingdom | 60 | 1 | 6 | 0.016667 |
| 112 | Sint Maarten | Netherlands | 57 | 9 | 12 | 0.157895 |
| 113 | French Polynesia | France | 55 | 0 | 0 | 0.000000 |
| 114 | Virgin Islands | US | 51 | 1 | 0 | 0.019608 |
| 115 | Diamond Princess | US | 49 | 0 | 0 | 0.000000 |
| 116 | Macau | China | 45 | 0 | 16 | 0.000000 |
| 117 | St Martin | France | 35 | 2 | 13 | 0.057143 |
| 118 | Northern Territory | Australia | 28 | 0 | 6 | 0.000000 |
| 119 | Prince Edward Island | Canada | 26 | 0 | 0 | 0.000000 |
| 120 | New Caledonia | France | 18 | 0 | 1 | 0.000000 |
| 121 | Qinghai | China | 18 | 0 | 18 | 0.000000 |
| 122 | Curacao | Netherlands | 14 | 1 | 10 | 0.071429 |
| 123 | Northern Mariana Islands | US | 13 | 2 | 0 | 0.153846 |
| 124 | Falkland Islands (Malvinas) | United Kingdom | 11 | 0 | 1 | 0.000000 |
| 125 | Greenland | Denmark | 11 | 0 | 11 | 0.000000 |
| 126 | Montserrat | United Kingdom | 11 | 0 | 1 | 0.000000 |
| 127 | Turks and Caicos Islands | United Kingdom | 11 | 1 | 0 | 0.090909 |
| 128 | Yukon | Canada | 8 | 0 | 0 | 0.000000 |
| 129 | Saint Barthelemy | France | 6 | 0 | 4 | 0.000000 |
| 130 | Northwest Territories | Canada | 5 | 0 | 0 | 0.000000 |
| 131 | Anguilla | United Kingdom | 3 | 0 | 1 | 0.000000 |
| 132 | Bonaire, Sint Eustatius and Saba | Netherlands | 3 | 0 | 0 | 0.000000 |
| 133 | British Virgin Islands | United Kingdom | 3 | 0 | 2 | 0.000000 |
| 134 | Saint Pierre and Miquelon | France | 1 | 0 | 0 | 0.000000 |
| 135 | Tibet | China | 1 | 0 | 1 | 0.000000 |
nan_indices = []

# handle nan if there is any, it is usually a float: float('nan')

for i in range(len(unique_provinces)):
    if type(unique_provinces[i]) == float:
        nan_indices.append(i)

unique_provinces = list(unique_provinces)
province_confirmed_cases = list(province_confirmed_cases)

for i in nan_indices:
    unique_provinces.pop(i)
    province_confirmed_cases.pop(i)
china_confirmed = latest_data[latest_data['Country_Region']=='China']['Confirmed'].sum()
outside_mainland_china_confirmed = np.sum(country_confirmed_cases) - china_confirmed
plt.figure(figsize=(16, 9))
plt.barh('Mainland China', china_confirmed)
plt.barh('Outside Mainland China', outside_mainland_china_confirmed)
plt.title('# of Coronavirus Confirmed Cases', size=20)
plt.xticks(size=20)
plt.yticks(size=20)
plt.show()
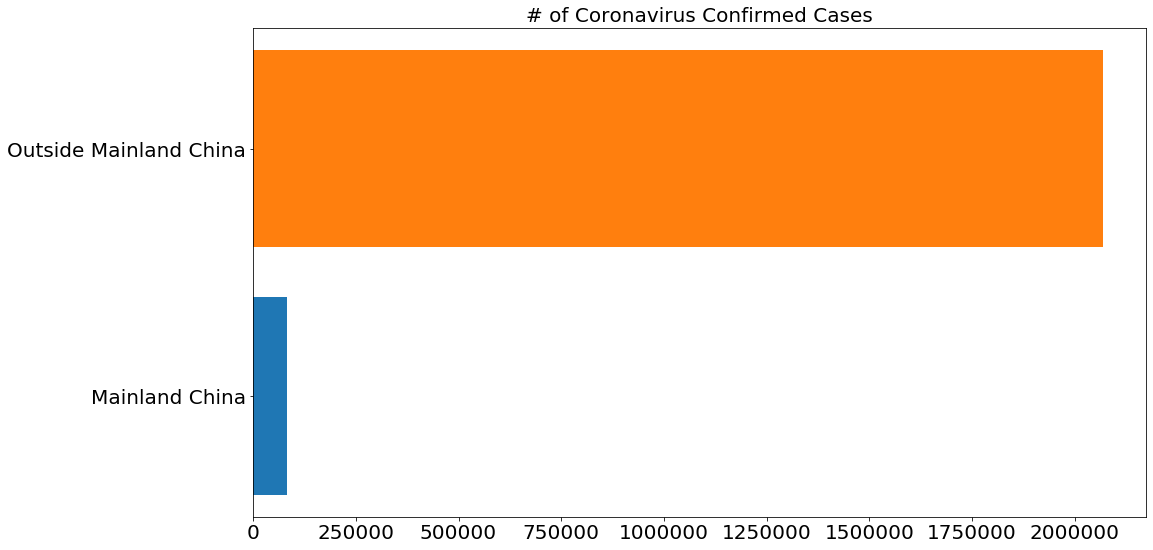
print('Outside Mainland China: {} cases'.format(outside_mainland_china_confirmed))
print('Mainland China: {} cases'.format(china_confirmed))
print('Total: {} cases'.format(china_confirmed+outside_mainland_china_confirmed))
Outside Mainland China: 2069244 cases
Mainland China: 83403 cases
Total: 2152647 cases
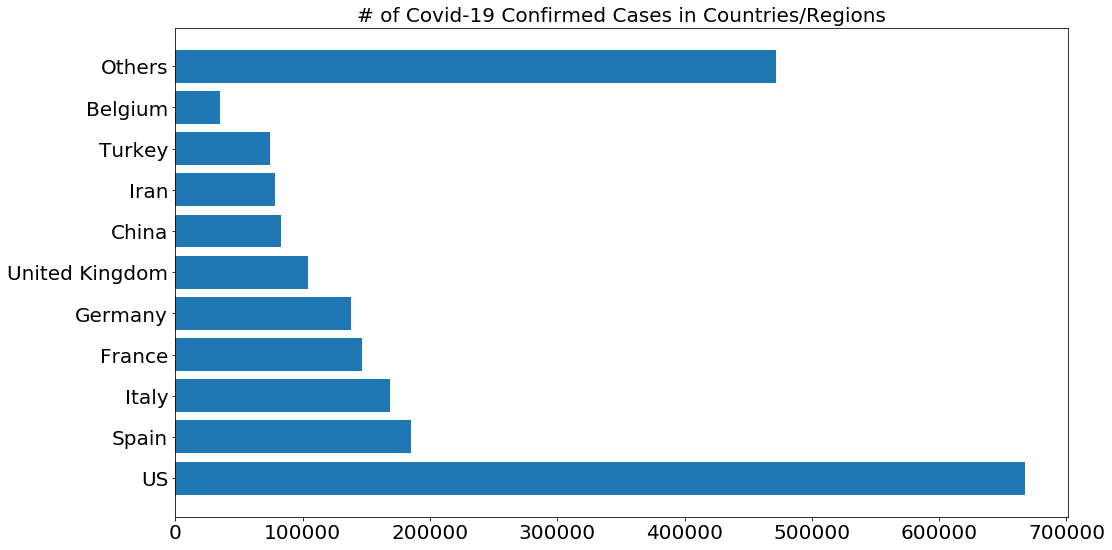
# Only show 10 countries with the most confirmed cases, the rest are grouped into the other category
visual_unique_countries = []
visual_confirmed_cases = []
others = np.sum(country_confirmed_cases[10:])

for i in range(len(country_confirmed_cases[:10])):
    visual_unique_countries.append(unique_countries[i])
    visual_confirmed_cases.append(country_confirmed_cases[i])

visual_unique_countries.append('Others')
visual_confirmed_cases.append(others)
def plot_bar_graphs(x, y, title):
    plt.figure(figsize=(16, 9))
    plt.barh(x, y)
    plt.title(title, size=20)
    plt.xticks(size=20)
    plt.yticks(size=20)
    plt.show()
plot_bar_graphs(visual_unique_countries, visual_confirmed_cases, '# of Covid-19 Confirmed Cases in Countries/Regions')
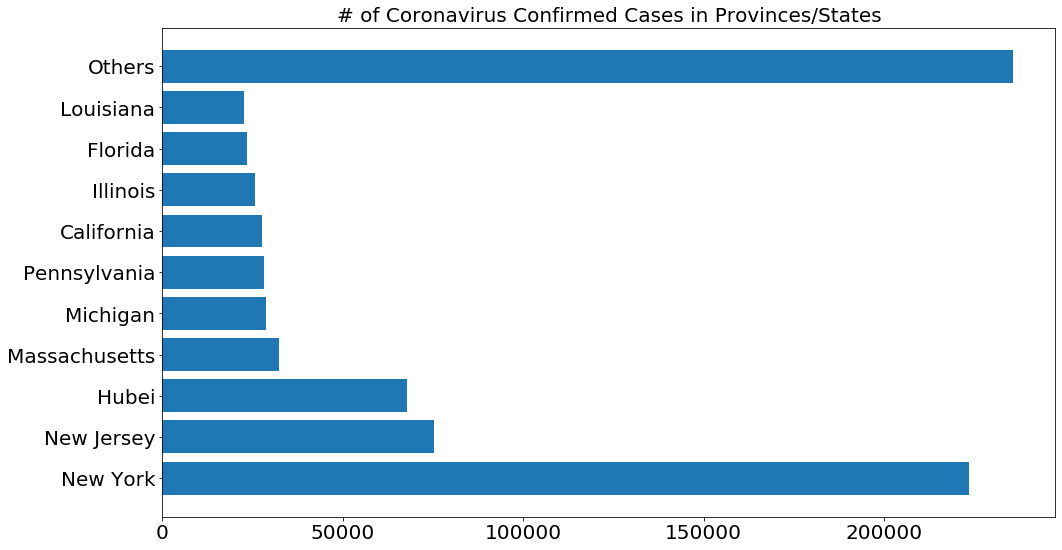
# Only show 10 provinces with the most confirmed cases, the rest are grouped into the other category
visual_unique_provinces = []
visual_confirmed_cases2 = []
others = np.sum(province_confirmed_cases[10:])
for i in range(len(province_confirmed_cases[:10])):
    visual_unique_provinces.append(unique_provinces[i])
    visual_confirmed_cases2.append(province_confirmed_cases[i])

visual_unique_provinces.append('Others')
visual_confirmed_cases2.append(others)
plot_bar_graphs(visual_unique_provinces, visual_confirmed_cases2, '# of Coronavirus Confirmed Cases in Provinces/States')
import matplotlib.colors as mcolors


def plot_pie_charts(x, y, title):
    random.seed(23)
    c = random.choices(list(mcolors.CSS4_COLORS.values()),k = len(unique_countries))
    plt.figure(figsize=(20,15))
    plt.title(title, size=20)
    plt.pie(y, colors=c)
    plt.legend(x, loc='best', fontsize=15)
    plt.show()
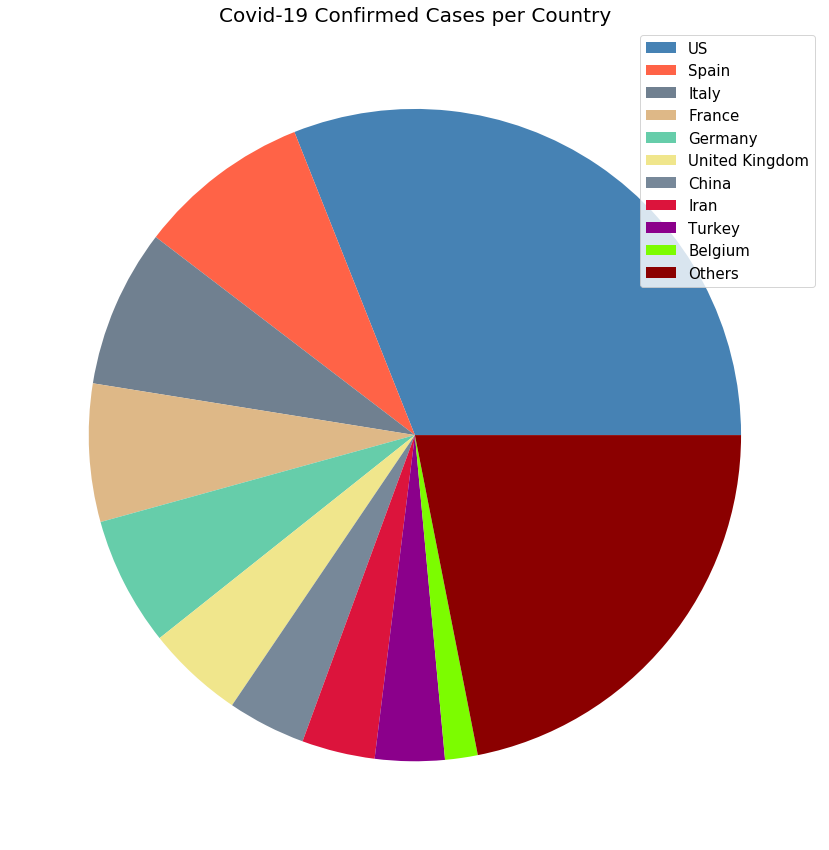
plot_pie_charts(visual_unique_countries, visual_confirmed_cases, 'Covid-19 Confirmed Cases per Country')
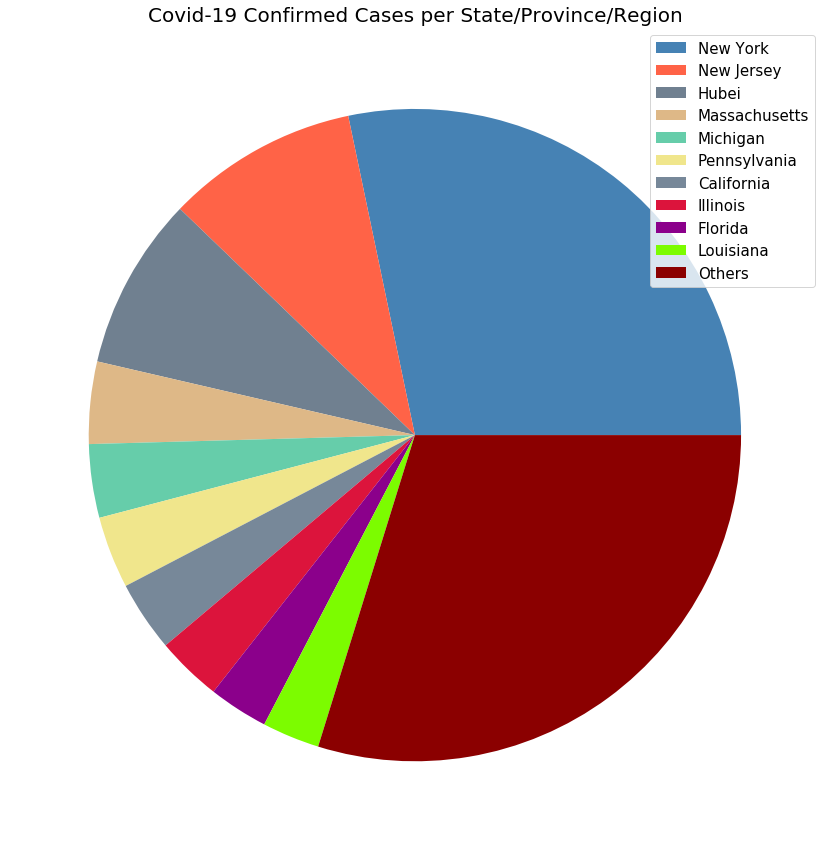
plot_pie_charts(visual_unique_provinces, visual_confirmed_cases2, 'Covid-19 Confirmed Cases per State/Province/Region')
# Plotting countries with regional data using a pie chart

def plot_pie_country_with_regions(country_name, title):
    regions = list(latest_data[latest_data['Country_Region']==country_name]['Province_State'].unique())
    confirmed_cases = []
    no_cases = []
    for i in regions:
        cases = latest_data[latest_data['Province_State']==i]['Confirmed'].sum()
        if cases > 0:
            confirmed_cases.append(cases)
        else:
            no_cases.append(i)

    # remove areas with no confirmed cases
    for i in no_cases:
        regions.remove(i)

    # only show the top 10 states
    regions = [k for k, v in sorted(zip(regions, confirmed_cases), key=operator.itemgetter(1), reverse=True)]

    for i in range(len(regions)):
        confirmed_cases[i] = latest_data[latest_data['Province_State']==regions[i]]['Confirmed'].sum()

    # additional province/state will be considered "others"

    if(len(regions)>10):
        regions_10 = regions[:10]
        regions_10.append('Others')
        confirmed_cases_10 = confirmed_cases[:10]
        confirmed_cases_10.append(np.sum(confirmed_cases[10:]))
        plot_pie_charts(regions_10,confirmed_cases_10, title)
    else:
        plot_pie_charts(regions,confirmed_cases, title)
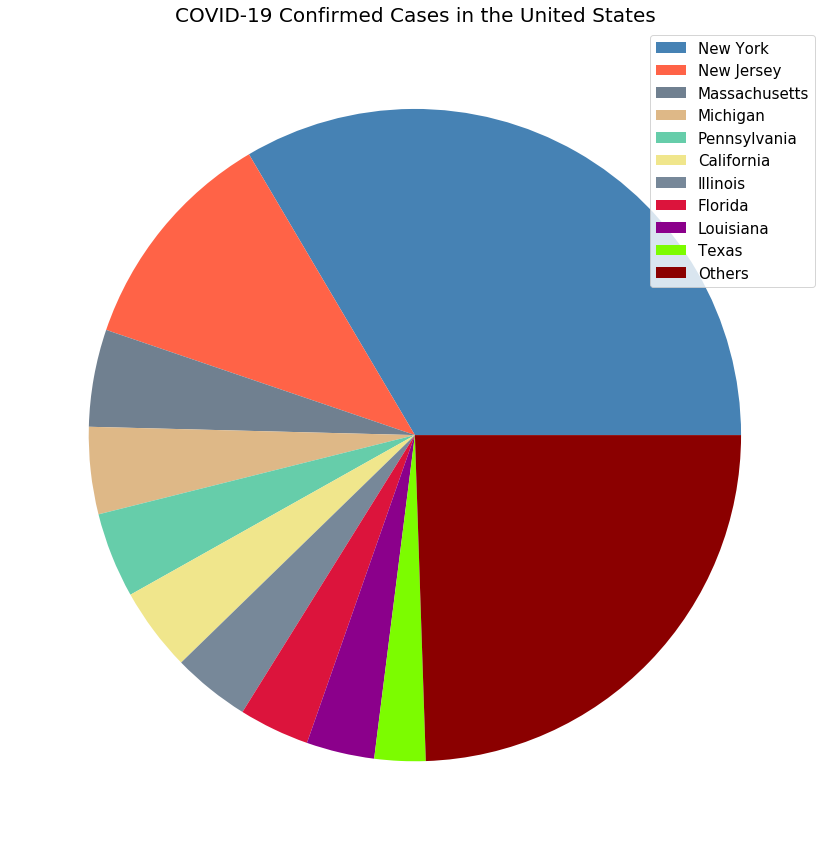
plot_pie_country_with_regions('US', 'COVID-19 Confirmed Cases in the United States')
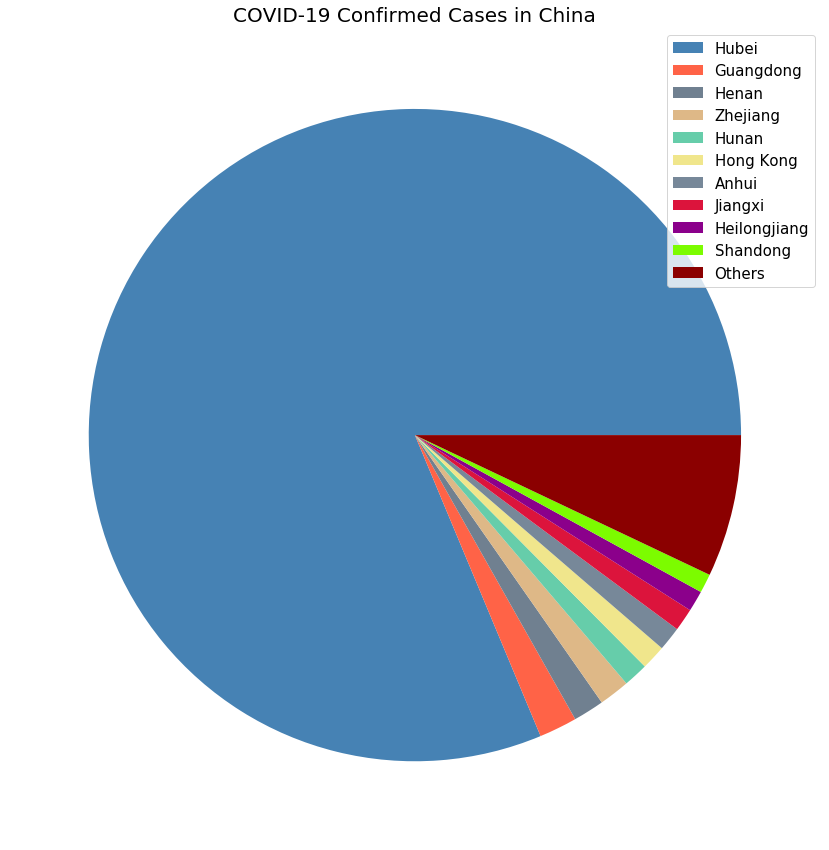
plot_pie_country_with_regions('China', 'COVID-19 Confirmed Cases in China')
-mkc2020
Written on April 18, 2020